What the Monthly 10 strategy does
The Monthly 10 strategy holds a long position on ten trading days per month and sits in cash the rest of the time. The assumption behind it: equities do not earn their return evenly across the month, but on recurring days in the calendar grid.
We ran the rule over 32 full calendar years of SPY: 1994 to 2025, 8,054 trading days, adjusted close including dividends.
The strategy works off the trading day of month (TDOM). TDOM 1 is the first trading day of a month, TDOM 2 the second; weekends and exchange holidays do not count. Depending on the calendar, a month has 19 to 23 trading days.
The strategy is long on these days:
- TDOM 1–4 — start of month
- TDOM 9–12 — mid-month
- the last two trading days — end of month
On every other day the money sits in cash, with no interest assumed. The marked days form three contiguous blocks per month, so three trades: buy at the close of the first day of a block, sell at the close of the last.
Time in market: 33 percent, not 48
Ten marked days out of roughly 21 amount to almost 48% of all trading days. The strategy is still invested only 33.4% of the time. The entry happens at the close of the first day of a block: that day is over once the position exists, so it contributes no return. Ten marked days leave seven return-bearing days.
The convention also shapes which block looks good in the breakdown. See "Limits of this decomposition" below.
SPY backtest, 1994–2025
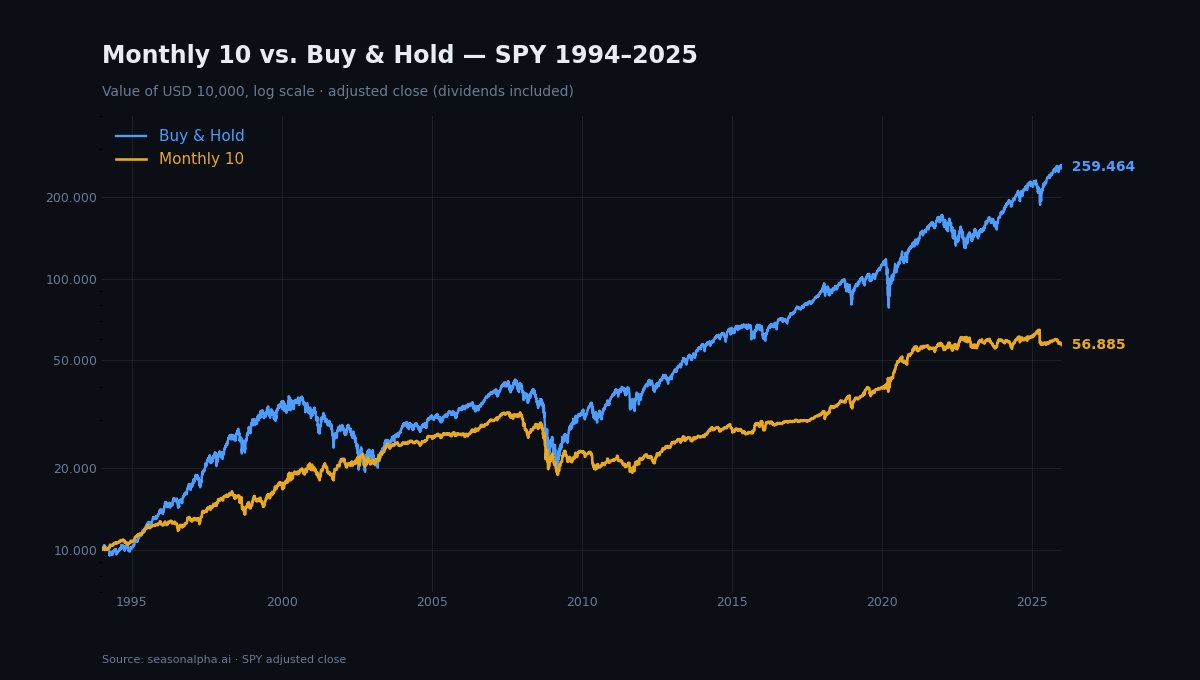
USD 10,000 grows to USD 259,463 under buy and hold and to USD 56,883 under Monthly 10.
| Metric | Monthly 10 | Buy & Hold |
|---|---|---|
| Total return | 469% | 2,495% |
| Return p.a. (CAGR) | 5.58% | 10.71% |
| Volatility p.a. | 10.79% | 18.84% |
| Return per unit of risk | 0.52 | 0.57 |
| Maximum drawdown | −41.0% | −55.2% |
| Time in market | 33.4% | 100% |
| USD 10,000 grew to | USD 56,883 | USD 259,463 |
The strategy nearly halves the swing and cuts the deepest interim loss by 14 percentage points. It costs 5.13 percentage points of annual return to do so.
Return divided by volatility gives 0.52 for Monthly 10 and 0.57 for buy and hold, so on a risk-adjusted basis the rule trails staying invested. Across single years it came out ahead in 10 of 32 years, or 31%.
Contribution of the three blocks
Each of the three blocks was traded 384 times over 32 years. Compounded separately, they split like this.
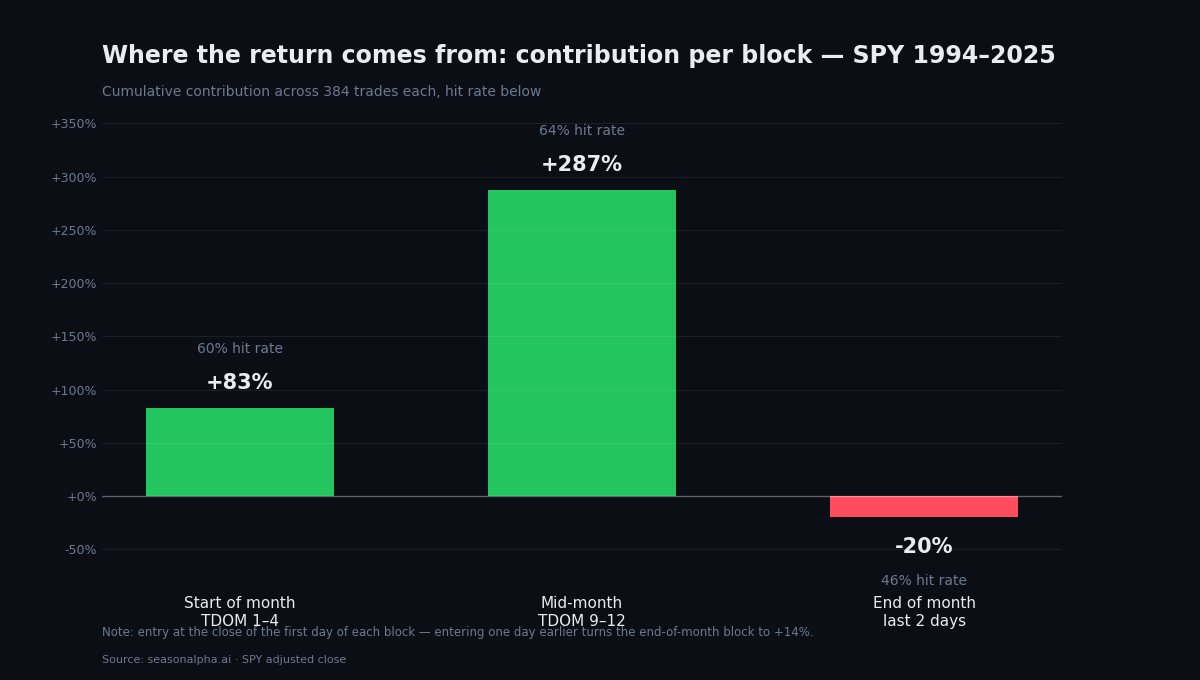
| Block | Trades | Hit rate | Cumulative contribution |
|---|---|---|---|
| Start of month (TDOM 1–4) | 384 | 60% | +83% |
| Mid-month (TDOM 9–12) | 384 | 64% | +287% |
| End of month (last 2 days) | 384 | 46% | −20% |
Mid-month delivers +287%, more than three times the start-of-month block, and carries the highest hit rate at 64%. The turn-of-month effect, meaning strength around the month boundary, is the better-known calendar pattern; in this rule set it ranks behind TDOM 9–12.
Limits of this decomposition
The minus in the end-of-month block is largely an artefact of the entry convention. Enter one trading day earlier, so that every marked day carries return, and the block flips from −20% to +14%, with the hit rate moving from 46% to 51%.
Important: the end-of-month block does not lose money systematically. It contributes close to nothing, and which side of zero it lands on comes down to a technical rule detail. What holds across both conventions is the ranking: TDOM 9–12 contributes most, end of month least.
Contribution of the excluded days
The 67% of the time Monthly 10 spends in cash was not worthless: those days compounded to +356%. They also carried the deeper setback, with a maximum drawdown of −58.9% against −41.0% for the strategy days.
Annual returns: a counter-cyclical profile
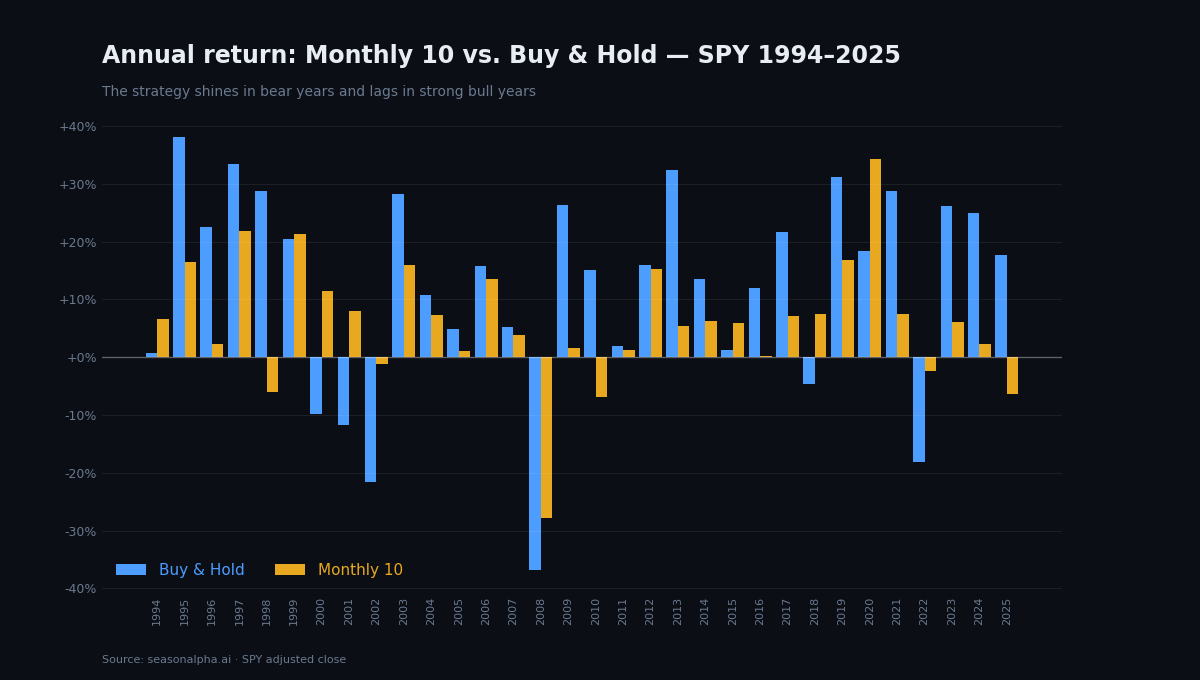
In bear years Monthly 10 is ahead:
- 2000: +11.4% vs. −9.7%
- 2001: +8.1% vs. −11.8%
- 2002: −1.2% vs. −21.6%
- 2008: −27.8% vs. −36.8%
- 2022: −2.5% vs. −18.2%
In strong bull years it falls well behind:
- 2013: +5.4% vs. +32.3%
- 2023: +6.1% vs. +26.2%
- 2024: +2.3% vs. +24.9%
Invested only a third of the time, you capture a fraction of an advance and a fraction of a decline. 2008 marks the limit of that cushion: −27.8% is a hard year even for a cash-heavy rule set.
What investors can take from this
Monthly 10 lowers volatility and return at the same time, and on a risk-adjusted basis it stays slightly behind buy and hold. On these numbers it is no substitute for a broad equity position. It fits better as a building block for portfolios where the swing is a hard constraint, or alongside a core holding.
Every figure above excludes transaction costs. Three trades a month means 36 round turns a year. With no return advantage to begin with, every fee comes straight out of the substance, so anyone testing the rule seriously has to model their own terms.
The usable result is the decomposition. That TDOM 9–12 does most of the work argues for examining individual trading days separately instead of judging rule packages as a whole.
Both are reproducible on SeasonAlpha: Monthly 10 sits in the backtest engine under the monthly patterns and can be applied to any ticker in the universe. The single-day view lives on the turn-of-month page, the side-by-side comparison of rule sets on the plain vanilla overview. To see which tickers currently show a notable monthly pattern, start with the seasonal scanner. Related reading: our backtest on the turn of month after down months.
Conclusion
Over 32 years of SPY, the Monthly 10 strategy delivers 5.58% p.a. against 10.71% for buy and hold, at 10.79% instead of 18.84% volatility and −41.0% instead of −55.2% maximum drawdown. Per unit of risk it stands at 0.52 against 0.57.
The decomposition shows the structure underneath: mid-month (TDOM 9–12) contributes +287%, start of month +83%, end of month close to nothing. Time in market is 33.4% because of the entry convention, not the 48% the day count suggests.
Not a signal: these are averages over 32 years with wide dispersion, not a forecast for next month. Test the rule on your own tickers and periods at seasonalpha.ai.
Frequently asked questions
What is the Monthly 10 strategy?
A rule-based strategy that is long only on ten marked trading days per month: TDOM 1–4, TDOM 9–12 and the final two trading days. All other days are spent in cash. Trades happen at the close of the first and last day of each block, so three trades per month.
Does Monthly 10 beat the market?
Not in our SPY backtest for 1994–2025. The strategy returns 5.58% per year against 10.71% for buy and hold and was ahead in only 10 of 32 years. It does reduce volatility (10.79% instead of 18.84%) and maximum drawdown (−41.0% instead of −55.2%). Risk-adjusted it still trails slightly, 0.52 against 0.57.
What does TDOM mean?
TDOM stands for trading day of month. TDOM 1 is the first trading day, TDOM 2 the second. Weekends and exchange holidays are excluded, which is why TDOM drifts away from the calendar day. What counts is the listing venue with its own holiday calendar, not a company's home country.
Why is the strategy invested only 33% of the time instead of 48%?
Because entry happens at the close of the first day of each block. That day has already played out and contributes no return. Ten marked days therefore leave roughly seven return-bearing days, which is 33.4% instead of the expected 48%.
Which part of the month contributes most?
Mid-month. Across 384 trades per block, TDOM 9–12 compounded to +287% at a 64% hit rate, while the start of month (TDOM 1–4) delivered +83% at 60%. End of month contributes close to nothing, and whether it lands slightly negative or slightly positive depends on the entry convention.