A narrow window, a large share of returns
The pre-FOMC drift is one of the most striking anomalies in the US stock market: an outsized share of long-run equity returns accrues not spread across thousands of trading days, but concentrated in the roughly 24 hours before a scheduled rate decision by the US central bank. When a Fed decision moves stocks, the interesting part often happens before anyone knows the decision.
This is not a seasonal calendar effect like "weak September" or "turn-of-month". The drift is event-anchored: it attaches to specific dates the Fed publishes far in advance. That is exactly what makes it compelling — and hard to dismiss.
What the pre-FOMC drift actually is
FOMC stands for Federal Open Market Committee — the body of the US central bank that sets the policy rate. It meets eight times a year for scheduled sessions whose dates are fixed months ahead. On the second day of the meeting, the announcement follows around 2:00 p.m. New York time.
The pre-FOMC drift refers to the fact that US stocks tend to rise, on average, in the narrow window before that 2:00 p.m. announcement — typically measured from the afternoon of the prior day. The move happens while the decision itself is still unknown. No new rate decision, no press conference, yet a measurable upward drift.
One clarification on scope: this is about scheduled meetings. Emergency sessions (such as March 2020) follow a different logic and do not belong in the same bucket.
What the research shows
The foundational study comes from David Lucca and Emanuel Moench (2015, "The Pre-FOMC Announcement Drift", published in the Journal of Finance, first as a New York Fed Staff Report). Their central finding: over the 1994–2011 sample, a large share of the total equity market excess return (the equity premium) accrued in this narrow 24-hour window ahead of scheduled FOMC announcements — the magnitude they report is around 80%.
That figure comes from the external study, not from SeasonAlpha data, and reflects their specific window and method. It is not a value to transfer one-to-one to any other time frame. The point is the order of magnitude: a tiny fraction of calendar days carries a disproportionate share of returns.
The debate has not settled since. A more recent paper in the Fed working-paper series (FEDS Working Paper 2026-023) revisits the effect and discusses how stable it is over time and where it comes from. On the practitioner side, a backtest (QuantSeeker, 25 Feb 2025) computed what a strategy would earn by holding SPY only around FOMC days: roughly 4% return per year with a Sharpe ratio of about 0.5 to 0.6 over 1993–2024. These values are external too, offered for context, not as trade advice.
A grounded approximation from SeasonAlpha data
SeasonAlpha works with normalized daily closing prices. The pure 24-hour window of the academic studies cannot be reproduced exactly with those — that would require intraday data from 2:00 p.m. the prior day. What can be measured cleanly is a day-based approximation: the average close-to-close daily return across three groups of days.
The data is the SPY ETF (S&P 500) over 2006–2025, anchored to the 165 scheduled FOMC meetings in that period (dates from the official Fed calendar). We distinguish:
- Day before the FOMC decision (the trading day immediately before the announcement),
- FOMC day itself (the announcement day),
- all other trading days as a benchmark.
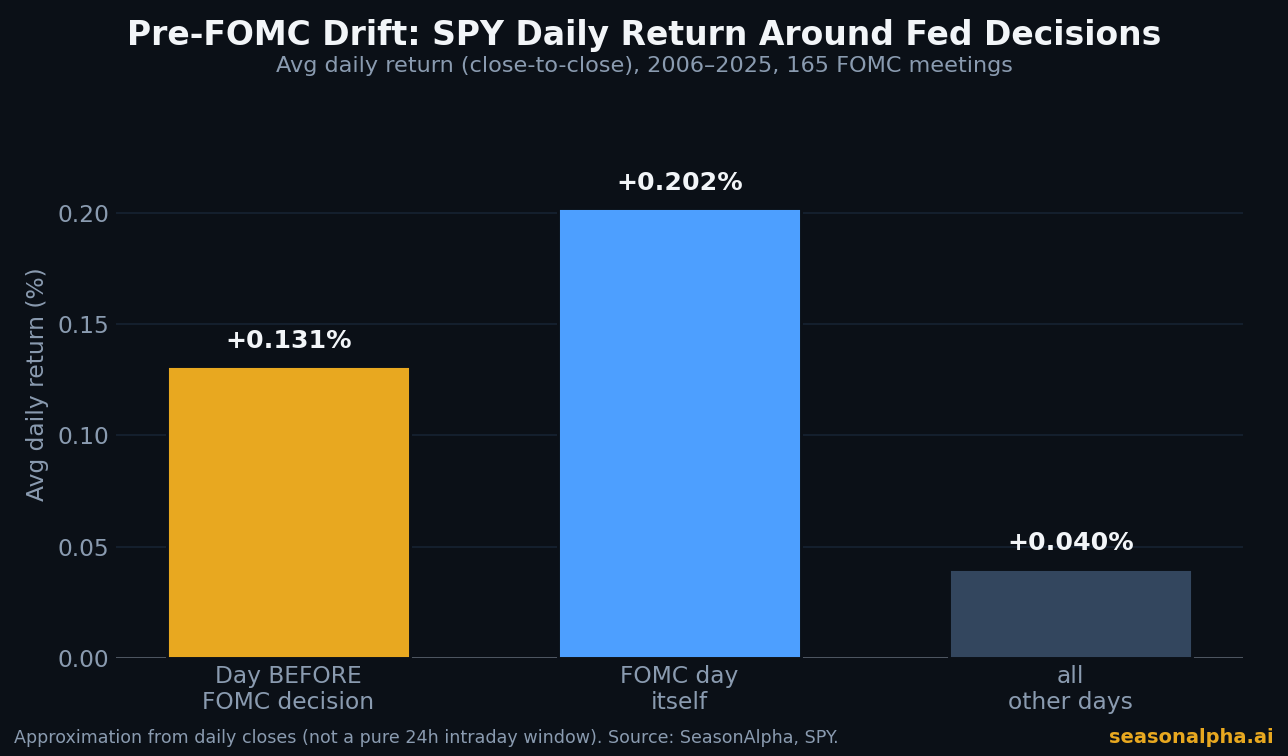
The result is clear. The day before the decision averages +0.131%, the FOMC day itself +0.202% — versus just +0.040% on all other days. The prior day thus returns about three times as much as an average ordinary trading day.
Summing the additive daily returns, the combined pre-FOMC and FOMC days account for roughly 22% of SPY's aggregate daily return over the period — while making up only 6.6% of all trading days. That is not the 80% figure of the original study, but it points the same way: a few event-bound days contribute disproportionately. The gap to the academic magnitude comes mainly from the coarser daily window and the different period.
The prior day holds, the announcement day fades
One detail rewards a second look. Narrowing the window to the last 15 years (2011–2025, 121 meetings), the prior day stays strong (avg +0.151%), while the FOMC day itself weakens markedly (avg only +0.026%). Put differently: the drift before the decision has been more robust in recent history than the reaction at the decision. That fits the debate over whether known patterns get partly arbitraged away over time — the reaction to the actual news fades faster than the anticipation before it.
Where does the effect come from?
No clean cause can be proven, but two serious lines of explanation stand out.
Risk premium. Ahead of a rate decision, uncertainty is elevated. Investors who bear that risk demand compensation — and it materializes as return beforehand. On this reading, the drift is the price for holding through the uncertainty until the announcement.
Information and expectation mechanics. An alternative view stresses that the drift is especially strong when the Fed ultimately delivers "good news". In that case, the rise is less a pure risk premium than anticipatory positioning that was confirmed on average. The two explanations are not mutually exclusive; which mechanism dominates is part of the ongoing research debate.
For retail investors, the cause matters less than the consequence: the effect is a statistical average pattern, not a law of nature. It says nothing about the next single meeting.
The limits of the pattern
Four caveats belong here.
It is an average. +0.131% on the prior day is a mean over 165 meetings with a standard deviation of about 1.6% — the spread from meeting to meeting is far larger than the effect itself. Individual pre-FOMC days were deeply red. The edge shows up only across many events, not on any single date.
Daily data ≠ 24h window. Our numbers are an approximation from closing prices. The pure, intraday-measured drift of the studies is only partly captured — the overnight and morning component sits partly in adjacent daily bars. The exact academic magnitude needs intraday data.
Arbitraged away. Known anomalies tend to lose force once enough capital exploits them. The decline of the pure announcement-day return over the last 15 years is a hint of that. Whether the prior-day drift persists is an open question.
No signal, no advice. The pre-FOMC drift is an observed pattern, not a trading signal and not investment advice. Transaction costs, taxes, and the risk that the next meeting turns out negative are real.
What it means for investors
The value lies in context, not timing. Knowing that stocks historically firmed ahead of Fed dates lets you read a quiet pre-meeting advance more calmly — and overreact less to a dip right after the announcement.
The scheduled FOMC dates are openly published. On SeasonAlpha you find them bundled on the central bank dates page, alongside the ECB, BoE and BoJ. For a related event-bound pattern — where a fixed monthly date shapes returns — see the article on the OPEX effect in the S&P 500.
Conclusion
The pre-FOMC drift is among the most robust documented anomalies in the US stock market: much of the return arises in the hours before scheduled Fed decisions, not after. The research (Lucca & Moench 2015, recent Fed work) and our own daily-close approximation for SPY (prior day avg +0.131% vs. +0.040% on ordinary days, 2006–2025) point the same way. It remains an average pattern with wide dispersion — context for your own judgment, not a schedule. You can check the next Fed dates any time at seasonalpha.ai.
The pre-FOMC drift is a descriptive pattern, not a tested effect — what that distinction means, beside ten further rules, is at eleven market rules, measured.
Frequently asked questions
What is the pre-FOMC drift in simple terms?
The pre-FOMC drift is the observation that US stocks rise on average in the roughly 24 hours before a scheduled Fed rate decision — that is, before the decision is even known. An outsized share of long-run equity returns falls into this narrow window.
Do stocks rise before every Fed decision?
No. It is an average pattern across many meetings. In our SPY approximation the day before FOMC averages +0.131%, but with a spread of about 1.6% — individual dates were clearly negative. The edge only shows up across many events.
Is the pre-FOMC drift a trading signal?
No. The effect is a statistical pattern, not a trading signal and not investment advice. Transaction costs, taxes, and the real possibility of a negative outcome at the next meeting limit its practical use. It serves as context, not timing.
Does the effect still work?
Partly. In our analysis the prior-day drift stayed stable over the last 15 years (avg +0.151%), while the return on the announcement day itself faded markedly (avg +0.026%). Known anomalies tend to weaken once broadly exploited — whether the prior-day drift persists is an open question.