Eleven signals, eleven times higher afterwards
The Zweig Breadth Thrust fired eleven times in our data since 1971. 120 trading days later the S&P 500 was higher in all eleven cases, by +15.65 % on average (median +13.65 %, n = 11). Across all 13,832 trading days from March 1965 to February 2020 as starting points, the same horizon returned +3.69 %, positive 68 % of the time.
That is the strong half of the story. The weak half: raise the lower threshold from 0.40 to 0.41 and the same calculation finds 14 signals. Swap the exponential average for a simple one and there are 19, including cases after which the index fell sharply.
We rebuilt the indicator from NYSE data covering 1965 to 2020. Below: what it measures, which signals occurred, what the market did next, and how much the result depends on the exact rule.
What the indicator measures
The Zweig Breadth Thrust is a market breadth indicator. Breadth asks how many stocks take part in a move, regardless of how far an index rises. An S&P 500 lifted by ten mega-caps has narrow breadth; a market in which almost everything rises has broad breadth.
The measurement uses the New York Stock Exchange. For each trading day you count the stocks that rose (advances, A) and those that fell (declines, D). The ratio A/(A+D) follows from that; unchanged issues are left out. A value of 0.5 means as many winners as losers.
Because the daily ratio jumps around, it is smoothed with a ten-day exponential moving average (EMA), which weights recent days more heavily than older ones. That puts the indicator in the family of advance-decline indicators. Unlike the well-known cumulative advance-decline line, it captures a swing over a few days.
The name refers to the investor and newsletter writer Martin Zweig. The indicator is often attributed to his book; Arthur Hill of StockCharts writes that it does not appear there. We therefore leave its origin open.
The rule: from below 0.40 to above 0.615 within ten days
A "thrust" is a push: the market flips from broad weakness to broad strength in a very short time. The rule we use has three parts:
- Oversold: the ten-day EMA drops below 0.40, meaning clearly more stocks have been falling than rising.
- Thrust: within at most ten trading days after the last day below 0.40, the EMA rises above 0.615.
- Reset: after a signal, only a fresh drop below 0.40 counts as a new starting point.
The signal falls on the first day above 0.615. For returns we enter at that day's close and measure the S&P 500 after 10, 30, 60, 90 and 120 trading days. The index is the price index without dividends.
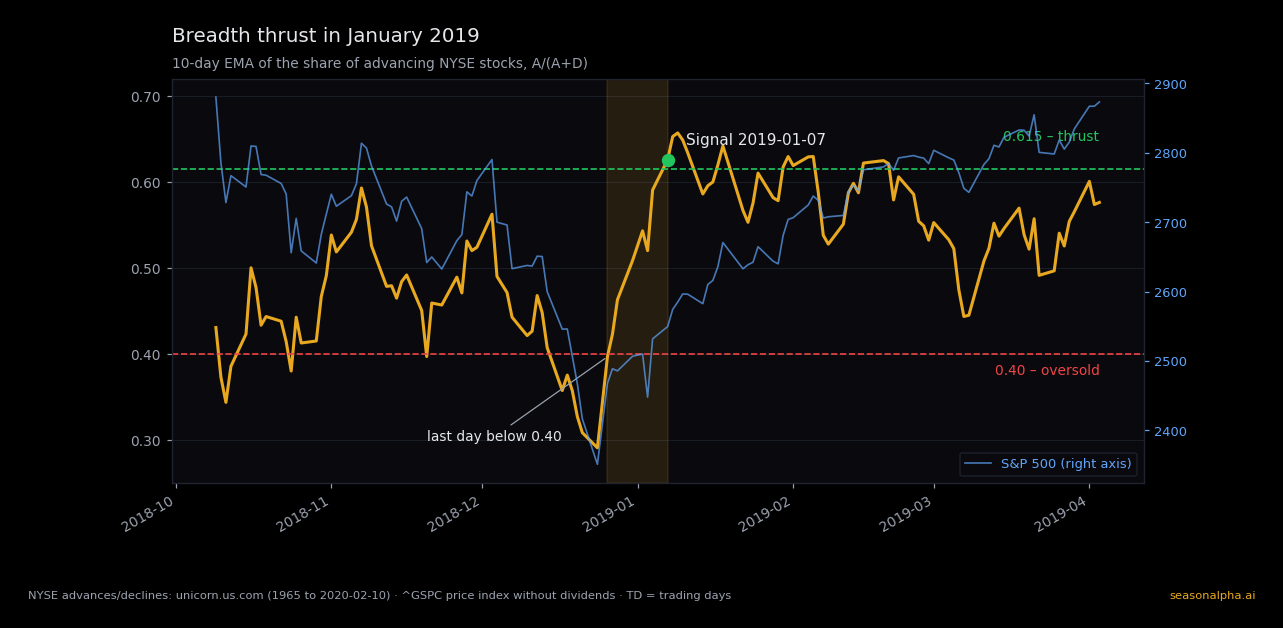
January 2019 shows the typical sequence. The S&P 500 fell hard in December 2018 and the breadth ratio slipped below 0.40. The rebound that followed was so broad that the EMA jumped above 0.615 within days. The signal came on 7 January 2019, after the low rather than before it.
Eleven signals since 1971
Our calculation finds eleven signals from 1971 to February 2020. The table shows the S&P 500 return from the signal-day close.
| Signal | 10 TD | 30 TD | 60 TD | 90 TD | 120 TD |
|---|---|---|---|---|---|
| 1971-12-03 | +3.3 % | +6.8 % | +9.8 % | +13.5 % | +13.7 % |
| 1974-10-10 | +0.6 % | −2.3 % | +1.8 % | +16.7 % | +16.8 % |
| 1975-01-03 | +0.4 % | +15.3 % | +16.9 % | +29.5 % | +33.8 % |
| 1982-08-20 | +8.5 % | +7.5 % | +21.2 % | +25.0 % | +28.3 % |
| 1984-08-03 | +1.1 % | +4.0 % | +1.5 % | +0.4 % | +8.8 % |
| 2004-05-25 | +1.6 % | −0.0 % | −1.3 % | +2.0 % | +6.4 % |
| 2009-03-18 | +2.1 % | +9.9 % | +19.1 % | +23.6 % | +29.1 % |
| 2011-10-14 | +4.9 % | −2.6 % | +5.5 % | +11.5 % | +12.9 % |
| 2013-10-18 | +1.0 % | +3.2 % | +6.0 % | +6.6 % | +4.1 % |
| 2015-10-08 | +1.9 % | +3.4 % | +0.2 % | −4.7 % | +2.9 % |
| 2019-01-07 | +3.3 % | +9.2 % | +12.7 % | +12.8 % | +15.4 % |
TD = trading days. The 1974 and 1975 signals sit so close together that their windows overlap from 60 trading days on, so the rally of early 1975 appears in both rows.
The list matches all eight dates the analyst Greg Morris published for 1965 to 2014. It adds the May 2004 signal, which Tom McClellan also lists, plus 2015 and 2019. The data come from the freely available archive of unicorn.us.com, which was discontinued on 10 February 2020. We removed rows on days without trading and rows with zero advances and declines.
What the S&P 500 did after the signal
An average after a signal means little until you know what the market does anyway. Each value therefore comes with the base rate: the same return measured from every one of the 13,832 trading days between March 1965 and February 2020.
| Horizon | Mean after signal | Median | Positive | Base rate (mean) | Base rate positive |
|---|---|---|---|---|---|
| 10 TD | +2.62 % | +1.94 % | 11/11 | +0.31 % | 58 % |
| 30 TD | +4.94 % | +4.02 % | 8/11 | +0.91 % | 61 % |
| 60 TD | +8.48 % | +5.95 % | 10/11 | +1.80 % | 64 % |
| 90 TD | +12.45 % | +12.81 % | 10/11 | +2.72 % | 65 % |
| 120 TD | +15.65 % | +13.65 % | 11/11 | +3.69 % | 68 % |
Signal columns n = 11, base rate n = 13,832 start days.
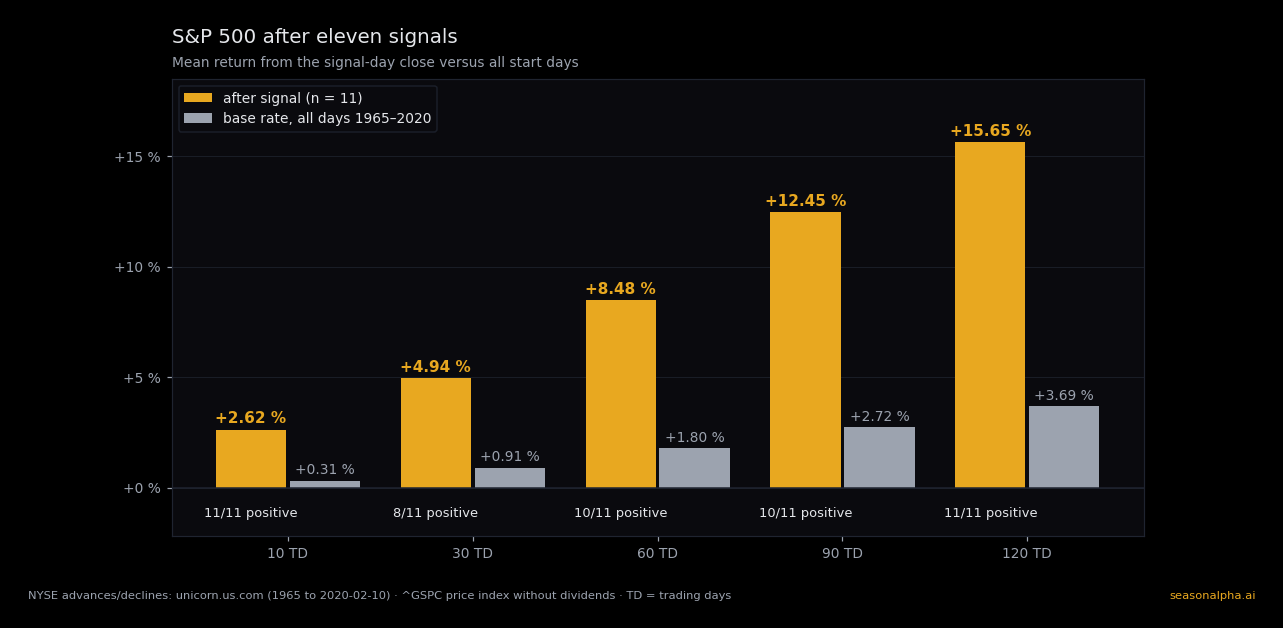
On every horizon the post-signal mean sits at four to just over eight times the base rate. The 30-day horizon is the weakest: three times the index was lower by then (1974, 2004, 2011). The largest setback came after October 2015, −4.7 % after 90 trading days. After 252 sessions, roughly one trading year, all eleven cases were in positive territory.
Entering at the signal-day close is a simplification, since anyone who sees the signal in the evening can buy the next day at the earliest. From the next day's close little changes: +15.51 % on average after 120 trading days, still 11 out of 11 positive.
One rule, three results
The standard values of 0.40, 0.615 and ten days are taken from common usage; we did not optimise them. It is still worth checking how sensitive the result is to small changes. We ran the same 1965–2020 data through seven variants.
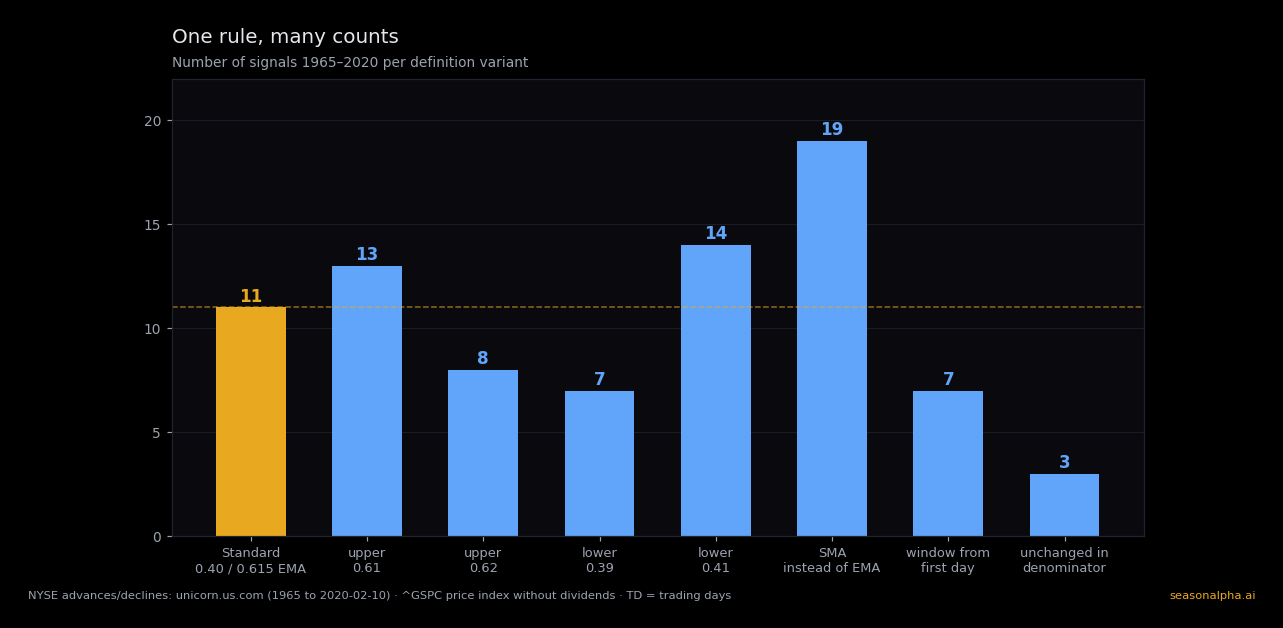
EMA vs SMA: 11 versus 19 signals
The averaging method makes the biggest difference. With a ten-day simple moving average (SMA) instead of the EMA, the calculation finds 19 signals instead of 11. Some of the extra ones ended badly: 60 trading days after the September 1973 signal the S&P 500 was 8.7 % lower, and 90 trading days after the May 1990 signal it was 12.2 % lower.
Moving a threshold by 0.01
The thresholds are tight. An upper threshold of 0.61 instead of 0.615 produces 13 signals, 0.62 only 8. At the lower end, 0.39 gives seven signals and 0.41 gives fourteen, among them one in February 2008, in the middle of the bear market before the financial crisis.
Where the ten-day window starts
How the window is counted matters as well. Start it on the first rather than the last day below 0.40 and 7 signals remain. Put unchanged stocks in the denominator, A/(A+D+U), and the EMA barely reaches the upper threshold: 3 signals.
That explains why counts differ. Other sources cite 16, 18 or 19 signals since the 1940s, usually without a precise definition and on different data. Our eleven apply to our rule and our period and cannot be combined with those counts.
2023 and 2025: signals outside our data
The archive behind our calculation ends on 10 February 2020. We have no breadth data from the same source for the period after that, and switching sources would quietly change the definition.
Arthur Hill of StockCharts reported signals in November 2023 and April 2025. We cite them as third-party reports and calculate no returns of our own for them. They are not part of the tables above.
Limits: eleven cases, no significance test
Eleven signals are few. Two of them overlap (1974 and 1975), and the rest are spread over five decades of very different markets. We do not run a significance test: at this sample size a p-value would be false precision, and the choice of rule variant would weigh more on the result than the test itself.
The pattern is a recovery pattern. The signal requires a broad decline first and only arrives once the rebound is under way. What gets measured is how markets continued after a sell-off followed by a strong counter-move. Our study of bonds as a stock market indicator shows a similar picture, with a decline before the signal there too.
Two further caveats: the returns are price returns without dividends, and the base rate comes from overlapping windows. And the way thresholds and windows shift the signal count shows how easily one can find a variant that looks good. On the intermarket page we showed, across 470 pairings, what is left once the number of attempts is counted. The same applied to Bitcoin as a leading indicator, where the threshold decided whether anything showed up at all.
What remains: under our definition the S&P 500 was higher 120 trading days after each of the eleven signals, against a base rate of 68 %. That describes the past on a small sample, with a rule whose count already shifts at a 0.01 change. More market rules put to the test are collected in Eleven Market Rules, Measured.
Frequently asked questions
What is the Zweig Breadth Thrust?
A market breadth indicator for the NYSE. It measures the share of advancing stocks among all advancing and declining stocks and smooths it with a ten-day EMA. A signal occurs when this value rises from below 0.40 to above 0.615 within ten trading days.
How many breadth thrust signals have there been?
Few. In our data from 1965 to February 2020 there were eleven, all from 1971 on. Almost twenty years passed without a signal between 1984 and 2004, while five came between 2009 and 2019.
Why do sources report different numbers of signals?
Because the rule is implemented differently in the details. A simple instead of an exponential average turns 11 signals into 19 on the same data, a lower threshold of 0.41 gives 14, and a differently counted ten-day window gives 7. Different data sources and periods add to the spread.
Were there false signals?
Under our standard rule the S&P 500 was higher after 120 trading days in all eleven cases. Shorter horizons saw setbacks: three losses after 30 trading days, and −4.7 % after 90 trading days following October 2015. In the SMA variant, the September 1973 and May 1990 signals were followed by clear losses.
When was the last Zweig Breadth Thrust signal?
In our data on 7 January 2019; the archive ends in February 2020. Arthur Hill of StockCharts later reported signals in November 2023 and April 2025. We calculate no figures of our own for those two.
Is the Zweig Breadth Thrust a buy signal?
No. The figures describe how the S&P 500 behaved after eleven historical signals. Eleven cases do not support a forecast, and small changes to the rule already change which cases count.