2026 Is a Midterm Year — and That Has Consequences
Every four years, the US elects a president. In between, in the second year of the term, the Midterm Elections take place — the congressional elections. 2026 is one such midterm year.
For investors this is relevant, because: midterm years historically show the deepest drawdowns in the entire presidential cycle. That is no coincidence — it has political reasons.
What Do 130 Years of Dow Jones Show?
We analyzed all 33 midterm years since 1898 — over 130 years of stock market history. The result:
| Cycle Year | Avg Max Drawdown | Number of Years |
|---|---|---|
| Year 1 (Post-Election) | –16.7% | 33 |
| Year 2 (Midterm) | –17.9% | 33 |
| Year 3 (Pre-Election) | –16.1% | 32 |
| Year 4 (Election) | –15.8% | 33 |
Midterm years have the deepest average drawdown at –17.9%. The difference compared to election years (–15.8%) is over 2 percentage points — that sounds small, but adds up over decades.
The Drawdown Pattern by Cycle Comparison
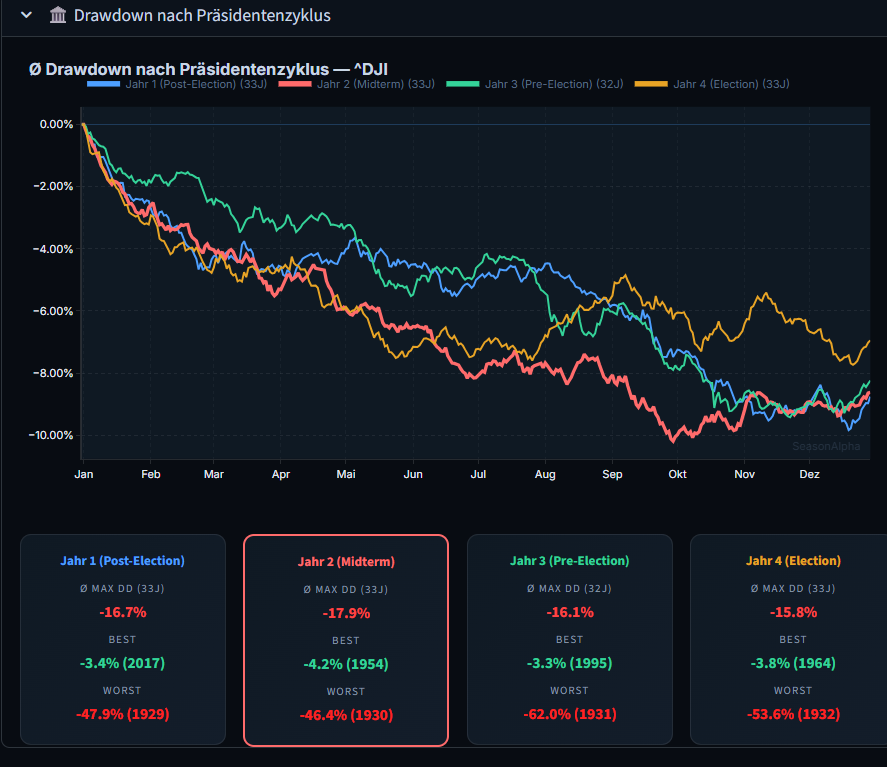
The chart shows the average drawdown pattern for each cycle position. The red line (midterm) falls noticeably deeper than the others from spring onwards — particularly between May and October.
The underlying pattern: in the midterm year political uncertainty is at its highest. The president has lost his initial euphoria, unpopular reforms are being pushed through, and the opposition mobilizes for the congressional elections. The stock market reacts to this with heightened nervousness.
The Worst Midterm Drawdowns
| Year | Max Drawdown | Context |
|---|---|---|
| 1930 | –46.4% | Beginning of the Great Depression |
| 1974 | –35.2% | Oil crisis + Watergate |
| 2002 | –31.5% | Dotcom crash aftermath |
| 1962 | –26.7% | Kennedy crisis (Cuba) |
| 1938 | –26.3% | Roosevelt recession |
Notable: four of the five worst midterm years were characterized by external crises. The midterm year alone does not cause crashes — but it amplifies existing risks.
The Best Midterm Years
Not every midterm year is bad:
| Year | Max Drawdown | Context |
|---|---|---|
| 1954 | –4.2% | Post-war boom |
| 1958 | –4.8% | Eisenhower era |
| 2014 | –7.3% | QE-driven bull market |
When the economic fundamentals are favorable, midterm years can also be calm. The cycle effect is a statistical trend, not a guarantee.
Where Does 2026 Stand?
As of April 2026, the Dow Jones is at a drawdown of around –8%. That is below the historical midterm average of –17.9% — but the trough typically arrives in midterm years in the second half of the year (September to October).
The interesting question is: will 2026 remain a mild midterm year like 2014 (–7%)? Or will it develop more towards 2002 (–31%)?
On SeasonAlpha you can track the current drawdown in real time — compared with the historical average of all midterm years.
What Does This Mean for Investors?
Three ways of thinking emerging from the midterm analysis:
- The second half of the year is historically riskier. In midterm years the drawdown typically deepens from May onwards. Anyone who needs liquidity in autumn should plan for this.
- After the midterm trough a strong rally often follows. The third cycle year (pre-election) shows the shallowest drawdown — historically markets rise strongly after the midterm elections. The entry point after the midterm trough was historically one of the best timing opportunities.
- The cycle effect is a framework, not a signal. Use it together with other indicators — not in isolation. On SeasonAlpha you can see the presidential cycle as an overlay in the annual cycle chart.
How to Analyze This on SeasonAlpha
- Open seasonalpha.ai → Annual Cycle
- Scroll down to Drawdown & Risk
- Open the "Drawdown by Presidential Cycle" section
- Compare the 4 cycle years in the chart — midterm (red) vs. pre-election (green)
Conclusion
Midterm years are historically the riskiest phase in the presidential cycle. 2026 is still early — the typical drawdown does not arrive until the second half of the year. Use the seasonal analysis on seasonalpha.ai to track the development in real time.
Frequently Asked Questions
Why are midterm years particularly volatile?
Political uncertainty is at its highest: the president often loses his congressional majority, legislative gridlock blocks growth impulses, and the opposition uses the midterm elections to mobilize. Investors price in this uncertainty.
Is 2026 automatically a bad stock market year?
No. Midterm years have deeper drawdowns on average, but the total return can still be positive. Many midterm years end in the black — the path there is just rougher.
When is the best entry point in midterm years?
Historically the trough in midterm years falls between September and October. The subsequent rally through year-end and into the third cycle year (pre-election) has historically been above-average in strength.