A Question Almost Nobody Asks
Imagine you buy a Google share on Monday evening at market close and sell it on Tuesday morning at the open. No watching charts all day, no analysis — just hold overnight.
Would you be better or worse off than someone who only trades during the day?
That is exactly what the Overnight vs. Intraday Split in SeasonAlpha answers — and the result is surprising.
What Is Behind the Split?
Every daily return of a stock consists of two parts:
- Overnight return (yesterday's close → today's open): The price movement that occurs outside of trading hours — driven by news, earnings, geopolitical events, or simply supply and demand in pre-market trading.
- Intraday return (today's open → today's close): The price movement during the active trading session — driven by active trading, announcements, and market dynamics.
The sum of both values gives the total return of the day (Σ).
Why does this matter? Because buy-and-hold investors benefit from the overnight return — they hold the stock overnight. Active traders, on the other hand, who only trade intraday, capture only the intraday portion. If the majority of the return happens at night, short-term daytrading is structurally difficult to justify.
Google Under the Microscope: Who Earns When?
Let us look at the historical data for the Google stock (GOOGL):
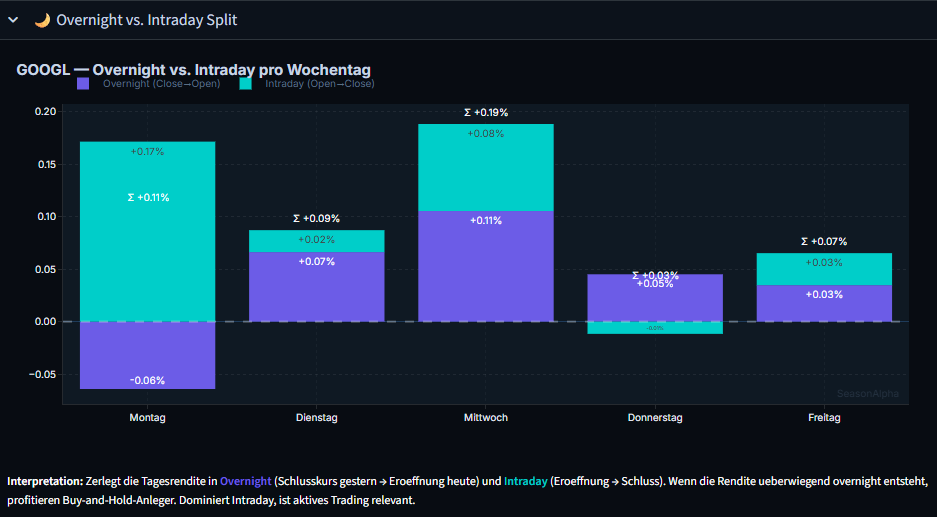
| Weekday | Overnight | Intraday | Σ Total |
|---|---|---|---|
| Monday | -0.06% | +0.17% | +0.11% |
| Tuesday | +0.07% | +0.02% | +0.09% |
| Wednesday | +0.11% | +0.08% | +0.19% |
| Thursday | +0.05% | ~0.00% | +0.03% |
| Friday | +0.03% | +0.03% | +0.07% |
The pattern is clear:
Wednesday is the strongest day with a total return of +0.19% — and here the overnight component (+0.11%) makes the biggest contribution. Anyone holding Google from Tuesday evening to Wednesday morning benefits disproportionately.
Monday is the only day with a negative overnight return (-0.06%). This means that over the weekend, Google experiences slight price pressure on average. The positive total return on Monday (+0.11%) comes entirely from intraday trading (+0.17%) — the market turns positive during the day.
Thursday is almost exclusively an overnight story: the intraday return is close to zero, and the total return (+0.03%) comes almost entirely from the overnight phase (+0.05%).
Tuesday and Friday are more balanced — both components contribute roughly equally.
What Does This Mean for Investors?
For long-term investors: With Google, a large part of the weekly return lies in the overnight phase — especially on Wednesdays and Thursdays. Anyone holding the stock continuously automatically captures this portion. This structurally favors buy-and-hold over active daytrading.
For active traders: Monday offers the most interesting intraday dynamics (+0.17%) — and that is despite a negative overnight start. There is a significant recovery during the trading day. Anyone going long intraday on Mondays (e.g., after the open) could benefit from this pattern.
Caution on Wednesday: Here the overnight return is the driver. Anyone who only buys at the open misses the strongest part of the move.
How to Find the Split for Your Stock
In SeasonAlpha, the Overnight vs. Intraday Split is built directly into the Weekdays page:
- Enter a ticker in the sidebar (e.g.,
GOOGL) - Open the "Weekdays" page
- Expand the "Overnight vs. Intraday Split" section
- The bar chart shows you both components separately — including the total return Σ
You can compare any ticker: does Apple (AAPL) behave the same as Google? Or does a different time of day dominate there? SeasonAlpha is built exactly for these kinds of comparisons.
Conclusion: The Time of Day Makes the Difference
For Google, the historical split shows a clear picture: the overnight phase is structurally important — especially on Wednesdays. Active daytraders systematically miss this portion, while long-term investors capture it automatically.
This does not mean intraday trading is pointless — but it is worth knowing when and where a stock's return actually occurs. Because trading at the wrong time of day means fighting against the historical current.
Find the split for your favorite stock at seasonalpha.ai — and see whether you are on the right side at night or during the day.