A little more return after big down days, but no sure buy
Between 2006-10-30 and 2026-10-29, SPY lost at least 2% on 211 trading days. Fifty trading days after a day of −2% or worse it stood +4.00% higher on average, measured from the close of the down day. Across all trading days of the same period the figure after 50 trading days was +2.34%.
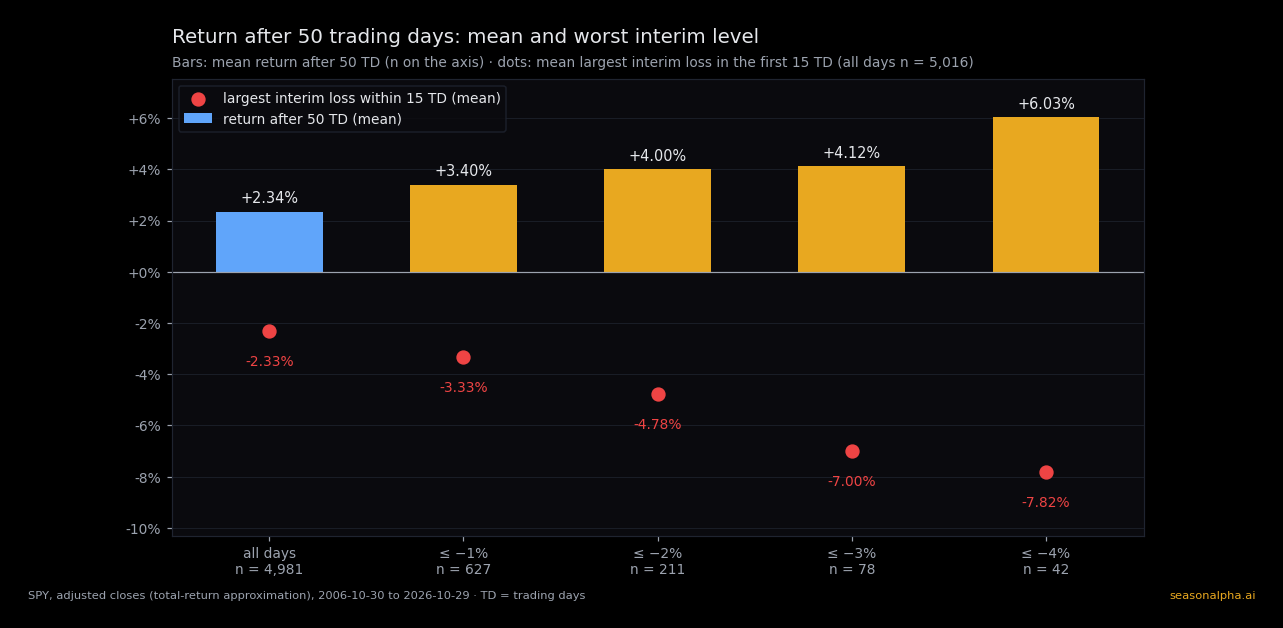
That sounds like a clear rule: buy after a weak day. Three numbers argue against it. After 50 trading days 69% of the −2% cases were positive, across all days 73% – the hit rate is not higher but slightly lower. During the first 15 trading days after a −2% day SPY fell on average to as low as −4.78% below the down-day close, across all days only to −2.33%. And almost the entire lead comes from the years since 2016.
Below: how often such days occurred, what happened afterwards on average, and how much the result depends on which years you look at.
How we count
We use closing prices of SPY, an ETF on the S&P 500, for the last 20 years: 5,031 trading days. Prices are adjusted for dividends, so the returns approximate an investor's total return, before costs and taxes.
- Down day: a trading day on which SPY lost at least 1, 2, 3 or 4% against the previous close. The levels are cumulative: a −3% day also counts at −1% and −2%.
- Return afterwards: from the close of the down day to the close of the 15th, 30th and 50th following trading day, roughly three weeks, six weeks and two and a half months. This describes the price path; it does not assume anyone could have bought at exactly that close.
- Comparison: the same return for every trading day of the period as a starting point. Only the gap to this value shows whether something special happens after a down day.
- Interim loss: the lowest close during the first 15 trading days afterwards, measured against the down-day close. If the price never goes below it, the case counts as 0.
Cases from the last weeks before 2026-10-29 whose window is not yet complete are not included in the returns.
How often SPY fell sharply
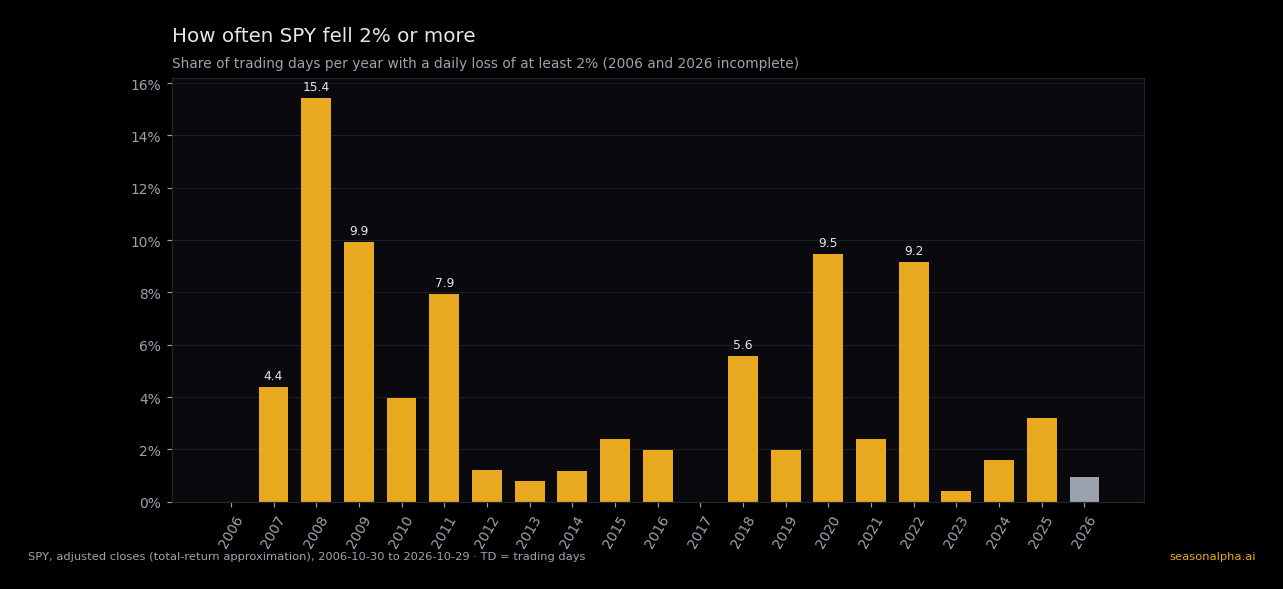
SPY closed lower on 2,251 of 5,031 trading days, 44.7% of all days. Losses of 2% or more are far rarer:
| Daily loss | Days | Share of trading days | Years with at least one case |
|---|---|---|---|
| ≤ −1% | 630 | 12.5% | 21 of 21 |
| ≤ −2% | 211 | 4.2% | 19 of 21 |
| ≤ −3% | 78 | 1.6% | 12 of 21 |
| ≤ −4% | 42 | 0.8% | 8 of 21 |
There are 21 calendar years because the period starts at the end of October 2006 and ends at the end of October 2026.
These days are spread very unevenly. 2008 alone brought 39 days of −2% or worse, 2017 none at all. Big down days cluster in a few crises: the financial crisis of 2008/09, the Covid crash of 2020 and the bear market of 2022.
What happened afterwards on average
| Starting day | n (50 TD) | after 15 TD | after 30 TD | after 50 TD |
|---|---|---|---|---|
| all trading days | 4,981 | +0.71% | +1.41% | +2.34% |
| ≤ −1% | 627 | +1.28% | +2.00% | +3.40% |
| ≤ −2% | 211 | +1.09% | +2.14% | +4.00% |
| ≤ −3% | 78 | +0.29% | +1.24% | +4.12% |
| ≤ −4% | 42 | +1.78% | +2.99% | +6.03% |
TD = trading days. The case count applies to 50 trading days; for the shorter windows it is the same or marginally larger, for all trading days 5,016 (15 TD) and 5,001 (30 TD).
After every loss level the mean return after 50 trading days was above the all-days value. After down days of 2% or more the gap after 50 trading days was +1.66 pp, after 15 trading days only +0.39 pp. Still, the pattern is not uniform: after −3% days SPY was only +0.29% higher on average after 15 trading days, below the all-days value.
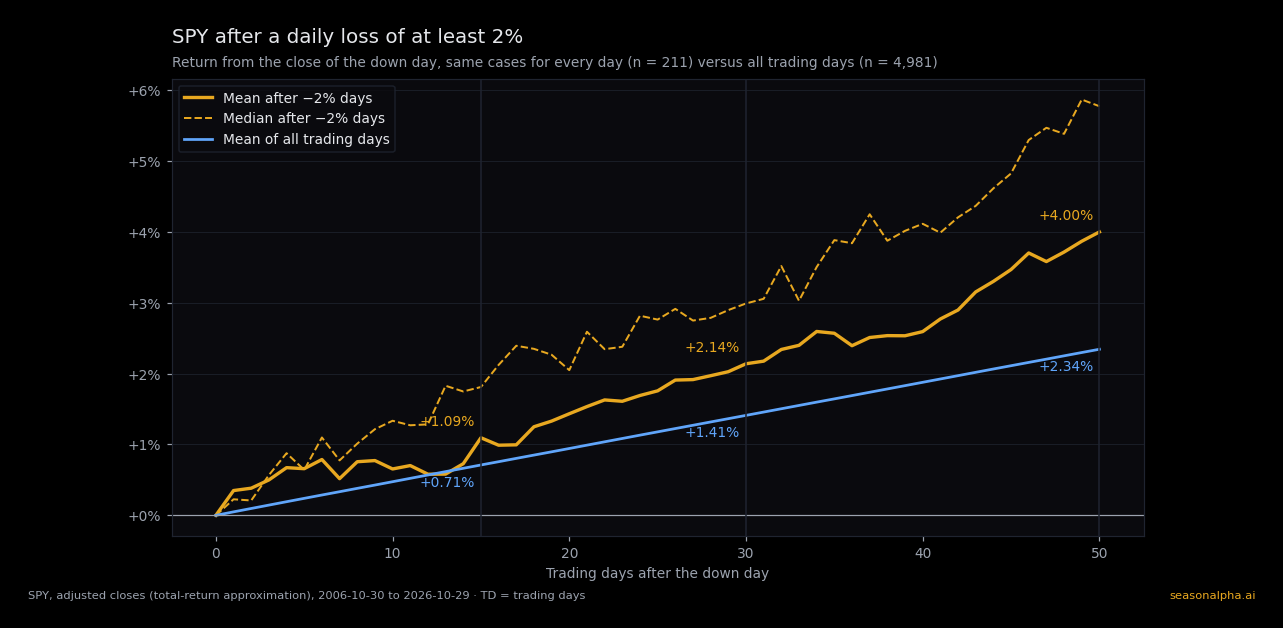
The median after 50 trading days for −2% days, +5.77%, is even higher than the mean. In other words: most cases went reasonably well, a few went very badly. The worst case after a −2% day ended 50 trading days later at −29.71%; the down day was September 22, 2008.
The price: deeper interim losses
The averages hide what happens between the down day and the target:
| Starting day | Median after 50 TD | Positive after 50 TD | Largest interim loss within 15 TD (mean) |
|---|---|---|---|
| all trading days | +3.27% | 73% | −2.33% |
| ≤ −1% | +4.33% | 72% | −3.33% |
| ≤ −2% | +5.77% | 69% | −4.78% |
| ≤ −3% | +3.99% | 67% | −7.00% |
| ≤ −4% | +5.15% | 71% | −7.82% |
The bigger the loss on the starting day, the deeper the market fell again on average over the next three weeks: after −2% days down to −4.78%, across all days only to −2.33%, after −4% days down to −7.82%. Big down days come in turbulent phases, and turbulent phases stay turbulent for a while. The higher average afterwards may partly be compensation for that risk – these data cannot prove it.
How stable the lead is
Because down days cluster, their 50-day windows overlap heavily. Eleven days with a loss of at least 2% in October 2008 essentially measure the same weeks eleven times. We therefore recalculated the gap for −2% days in several ways:
| Sample (−2% days, 50 TD) | n | Mean after −2% day | Mean of all days in the same sample | Difference |
|---|---|---|---|---|
| all cases | 211 | +4.00% | +2.34% | +1.66 pp |
| thinned chronologically | 51 | +2.68% | +2.34% | +0.34 pp |
| excluding autumn 2008 to June 2009 and spring 2020 | 140 | +4.81% | +2.65% | +2.15 pp |
| 2006-10-30 to 2016-10-28 | 123 | +1.91% | +1.59% | +0.33 pp |
| 2016-10-31 to 2026-10-29 | 87 | +6.96% | +3.08% | +3.87 pp |
Thinned chronologically means: a down day only counts if at least 50 trading days have passed since the last counted one, so no windows overlap. Of 211 cases, 51 remain, and the gap after 50 trading days shrinks to +0.34 pp. This selection favours the first down day of each turbulent phase, so it answers a slightly different question. But it shows how strongly the result depends on which days within a cluster are counted.
Excluding the two crisis blocks (the down day and the 50 following days lie outside September 2008 to June 2009 and mid-February to June 2020), the gap actually rises to +2.15 pp. Taken together, the two crisis blocks lower the average. But they contain both the worst cases (autumn 2008) and particularly strong recoveries (March 2020).
The two decades differ the most: from 2006 to 2016 the gap after 50 trading days was +0.33 pp, from 2016 to 2026 +3.87 pp. In the second half the market usually recovered quickly after setbacks. Why is not examined here, and whether that persists, the statistics cannot say.
Limits of this analysis
- No significance test. The cases are not independent: down days cluster, windows overlap, and many cases trace back to the same few crises. A standard test would suggest a certainty the data do not provide. Why a p-value promises more than it delivers here is explained in our article on the p-value.
- 20 years are few market phases. Three big crises shape the result. Another period may look different, as the gap between the two decades already shows.
- Closing prices. We measure close to close. Buying the next morning gets a different price; intraday losses are not captured by the interim loss.
- One index. The analysis covers the broad US market. Single stocks or other indices can behave very differently after down days.
What this means for investors
Over the last 20 years, a big down day was on average not a bad time to buy the S&P 500 – but not a clearly better one than any other day either. The lead depends heavily on the period since 2016 and shrinks in the chronologically thinned selection. Anyone buying after a weak day has to expect the market to fall noticeably further in the following weeks than usual. This describes the past; it is not a buy signal.
How deep declines typically go within a year is covered in our article on drawdowns in crash years; the difference between return and drawdown is explained in return vs. drawdown. Other market rules we have tested are collected in the overview.
Frequently asked questions
How often does the S&P 500 fall 2% or more in a day?
In the 20 years from 2006-10-30 to 2026-10-29, SPY lost at least 2% on 211 of 5,031 trading days, 4.2% of all days. The cases cluster strongly: 2008 had 39 such days, 2017 none.
Does the S&P 500 rise after a big down day?
On average, yes: 50 trading days after a daily loss of at least 2%, SPY was up +4.00%, across all days +2.34%. But after 50 trading days only 69% of the −2% cases were positive, across all days 73%, and in the first three weeks after −2% days the market fell on average to −4.78%.
Does "buy the dip" work?
The data show a small lead that comes mainly from the years since 2016 and shrinks to +0.34 pp after 50 trading days when only non-overlapping cases are counted. That is not a reliable advantage, and it comes with deeper interim losses.
Why is there no p-value here?
Because down days cluster and their windows overlap. A test that assumes independent cases would overstate the certainty.