Long gamma or short gamma? Why some days are calm and others turn wild
Some trading days drift along in a tight range — every dip gets bought, every breakout fizzles. On other days a small move snowballs into an avalanche. The difference often has less to do with the news than with a structural state of the market: the gamma regime.
Whether the market is currently in a long-gamma or a short-gamma regime decides whether options dealers dampen moves or amplify them. It is the single most important switch in dealer positioning — and the building block you need before terms like call wall or vanna make any sense. This article explains both regimes, the tipping point between them (the zero-gamma flip), and how we turn all of it into a gamma light at SeasonAlpha.
What gamma exposure (GEX) actually measures
Quick context in case you are new: when you buy an option, a market maker — the "dealer" — usually sells it to you. He does not want market risk, only the bid-ask spread. So he hedges his position in the underlying (delta hedging).
Gamma measures how much that hedge changes when the price moves. And because dealers run enormous books, their bundled hedging flows become a market force in their own right. The aggregate figure across all open options is called gamma exposure, or GEX. We show it as the Market Gamma Index (net GEX).
If you want the fundamentals — delta hedging, vanna, charm, call and put walls — from scratch, they are in the base article Dealer Positioning Explained. Here we go deep on one thing: the sign of gamma and what it means for volatility.
The two regimes: vol-suppressing vs. vol-amplifying
The entire behaviour hangs on a single sign — that of the dealers' net gamma.
Long gamma (positive net gamma): the shock absorber
When dealers are net long gamma, they hedge against the move. If the price rises, they have to sell; if it falls, they have to buy. They trade counter-cyclically and act like a shock absorber: moves get braked, the range stays tight, and the market leans toward mean reversion and "pinning" at large strikes. Dips get structurally bought. This is the vol-suppressing regime.
Short gamma (negative net gamma): the accelerant
When dealers are short gamma, the logic flips. Now they must hedge with the move: buy into rising prices, sell into falling ones. They pour fuel on the fire. A small impulse can snowball into a trend, volatility rises, and swings get larger. Dips get sold rather than bought. This is the vol-amplifying regime — the breeding ground for the notorious sell-off cascades.
| Feature | Long gamma (positive) | Short gamma (negative) |
|---|---|---|
| Dealer hedging | sells strength, buys weakness | buys strength, sells weakness |
| Effect on vol | dampening (vol-suppressing) | amplifying (vol-forcing) |
| Typical behaviour | mean reversion, tight range | momentum, trend, large swings |
| Dips get ... | bought (stabilising) | sold (accelerating) |
| Analogy | shock absorber | accelerant |
The zero-gamma flip: the tipping point
Between the two worlds lies a sharp boundary — the zero-gamma flip. This is the price level at which net gamma changes sign. Above it, the market is (in the typical case) long gamma and calm; below it, short gamma and jumpy.
What matters is the distance from price to the flip. If spot sits comfortably above it, the dampening regime looks stable. If it hugs the flip, the regime can tip on even a small move — and the shock absorber becomes the accelerant. That proximity is itself a fragility signal: not direction, but the vulnerability to flipping.
A real example from our live snapshot of 2 August 2026 makes it tangible: SPY stood around 747, while the zero-gamma flip sat near 748. Price was practically glued to the tipping point — just inside short-gamma territory. The aggregate Market Gamma Index was clearly negative at roughly −3.4 bn $ per %, and the regime read vol-amplifying. A telling nuance: while the index ETFs (SPY, QQQ, IWM) were short gamma, several mega-caps such as MSFT, NVDA and AMZN were simultaneously long gamma. The overall picture is rarely uniform — which is exactly why the aggregate view is worth taking.
What the research says: a practitioner idea, academically validated
Sourcing matters here, because a young finance site has to be precise about where its claims come from.
The origin is practitioner knowledge. The term "GEX" and the two-regime intuition come from the industry white paper (2016). Their much-quoted claim: at low volatility, the sign of gamma predicts market stability better than the VIX itself. That is a thought-provoking observation — but it is a vendor source, not a peer-reviewed result. It should be treated as such.
The academic validation comes from "Gamma Fragility" by Barbon & Buraschi (2021). Using hard data, they show that when aggregate dealer gamma is negative, intraday momentum emerges (moves persist); when it is positive, reversal dominates (moves revert). The effect is strongest in illiquid conditions. That maps precisely onto the shock-absorber-vs.-accelerant logic.
One important caveat: the effect Barbon & Buraschi measure is intraday and very short-lived — it usually fades within one or two trading days. It is not a recipe for trading daily moves. So we use only the regime classification (long vs. short gamma as context), not the short-term trading effect. And Barbon & Buraschi is a widely cited working paper, not yet a finally refereed publication — that, too, belongs in the picture.
The gamma light at SeasonAlpha: the regime at a glance
We turn this two-regime logic into a simple gamma light. It combines two pieces of information: the sign of the Market Gamma Index (dampening or amplifying) and the distance to the zero-gamma flip (how prone the current regime is to flipping).
- Green / long gamma: dampening regime, spot well above the flip — tends toward calm, mean-reverting days.
- Red / short gamma: amplifying regime, spot below the flip — a raised tendency toward trends and large swings.
- Near the flip: transition zone — the regime can tip at any moment, so caution is warranted.
You will find the light live on the Dealer Positioning page — for SPY, QQQ and the most important US underlyings. As a complement to overall market risk, it pairs well with our Crash Early Warning: both tools describe fragility, but from different angles — the gamma regime from options mechanics, the crash light from the broader market regime.
Regime meets seasonality: the SeasonAlpha angle
Now the part no pure gamma vendor delivers. GEX pages show the state right now. Seasonality pages show the calendar pattern on average. We own both — and that is the real lever.
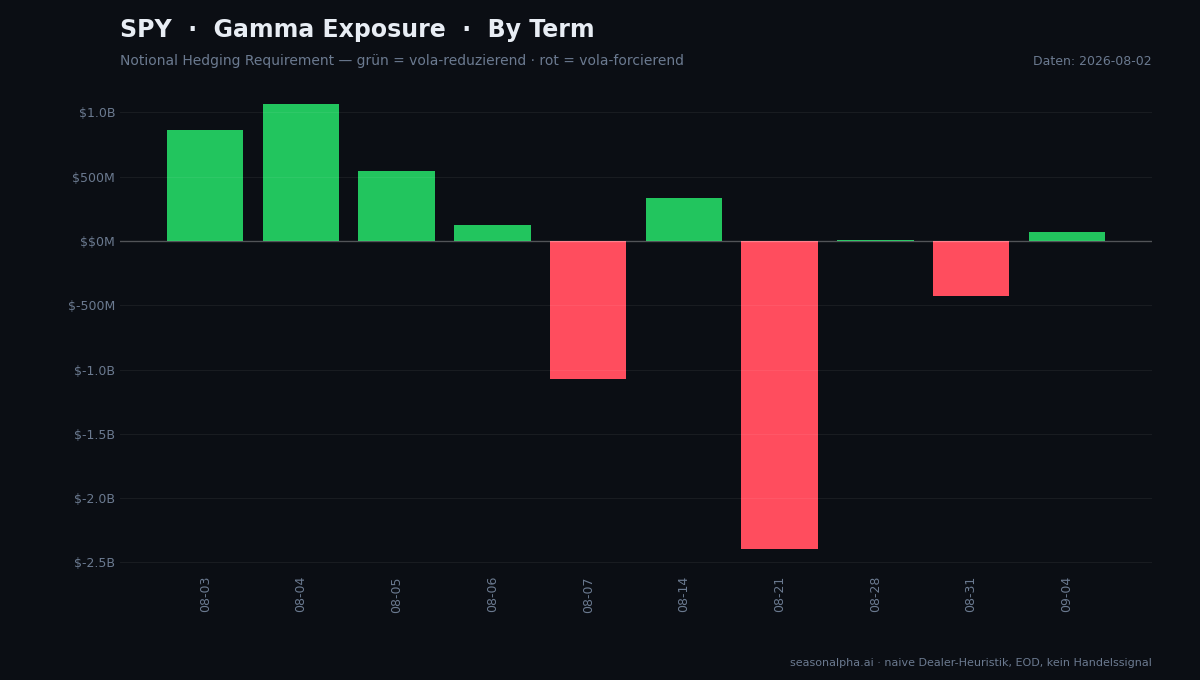
The chart shows the net gamma of SPY by expiry. The sign per maturity reveals the regime: positive bars (green) are long gamma — dealers dampen moves, the market runs calmer; negative ones (red) are short gamma — dealers amplify moves, the market turns fragile. This is exactly where the gamma regime and seasonality meet: in the shift of these regimes along the calendar.
The second chart breaks it down into individual calendar months (current month highlighted). Late summer and early autumn have historically been among the bumpier windows of the year — thinner liquidity, wider dispersion. A market that happens to be short gamma in such a window (as in the snapshot above) stacks two fragility-boosting factors: the structural amplifier from options mechanics and the seasonally thinner liquidity. "Pattern" becomes "mechanism plus context".
That is the moat: we do not just show that a window is statistically notable — the gamma regime adds a structural layer that explains why swings might be larger or smaller right now.
Limits: what the gamma light can — and cannot — do
When real money is on the line, we put the limits on the table instead of faking precision:
- Naive dealer heuristic. We assume dealers are long calls and short puts. That is a proven first approximation for index gamma, but not a real inventory model like commercial providers — and no knowledge of the actual dealer books.
- End-of-day Yahoo data. We compute on open interest and implied vol at the close. Our values therefore differ from proprietary intraday/0DTE models.
- Live snapshot, not a time series. Our gamma history only begins with the snapshot cron (from summer 2026). Statements like "how often was the market short gamma" cannot (yet) be cleanly backtested — the light is a current state, not a vetted historical statistic.
- Not a signal. The regime is context, not a buy or sell signal. The academic fragility effect is intraday and transitory (one to two days) — we use only the classification.
These limits are not a flaw but part of the method. Anyone who takes the regime seriously has to know how robust the data behind it is.
Conclusion
The gamma regime is the most memorable building block in dealer positioning: a single sign decides whether dealers dampen the market (long gamma, vol-suppressing) or stoke it (short gamma, vol-amplifying). The zero-gamma flip marks the tipping point — and how close price sits to it is a fragility barometer.
Practitioner knowledge from the industry, backed academically by Barbon & Buraschi, clearly labelled as regime context with no signal claim: that is how a buzzword becomes a useful thinking tool. And when you combine it with our seasonal calendar, you see not just the current state but the seasonal environment it appears in. Try the gamma light on seasonalpha.ai/dealer-positioning yourself.
Frequently Asked Questions
What does long gamma and short gamma mean?
Long gamma (positive net gamma) means dealers dampen moves — they sell into strength and buy into weakness, so the market leans toward a tight range and mean reversion. Short gamma (negative net gamma) is the opposite: dealers amplify moves, volatility rises, and trends tend to persist.
What is the zero-gamma flip?
The zero-gamma flip is the price level at which net gamma changes sign — the boundary between the vol-suppressing and the vol-amplifying regime. When price hugs the flip, the regime can tip on even small moves. It is read as a fragility hint, not a directional forecast.
Is the gamma regime a trading signal?
No. It is structural context, not a buy or sell signal. The academically documented effect (Barbon & Buraschi) is intraday and very short-lived; we use only the regime classification as framing, not for short-term trades.
Does GEX really beat the VIX?
That is the claim from the industry white paper — at low volatility the sign of gamma is said to indicate stability better than the VIX. It is a thought-provoking practitioner observation from a vendor source, not a peer-reviewed result. We treat it as a hypothesis, not a law.