Why does the market so often rise in the week before options expiry?
Anyone who knows S&P 500 seasonality has seen the pattern again and again: in the week before the third Friday of the month, the market tends to drift higher. Dealer Positioning provides the explanation that pure calendar statistics cannot give — the mechanism behind the pattern.
That is exactly what our new feature is about. We calculate how options dealers (the market makers) are positioned — through the metrics gamma, vanna and charm. And we marry that with our exchange-accurate seasonal calendar. "The market often rises before OPEX" becomes "the market rises before OPEX because dealers have to buy back their hedges".
What is dealer positioning, really?
When you buy an option, someone sells it to you — usually a market maker. This dealer does not want market risk; they only want to earn the bid-ask spread. So they hedge their position in the underlying (delta hedging). If the market buys lots of calls, the dealer buys shares; if the market buys puts, they sell shares.
The key point: this hedge is not static. It changes when the price moves, when volatility shifts and when time passes. These rates of change are exactly what the three "Greeks" measure:
- Gamma — how much the hedge changes when the price moves.
- Vanna — how much the hedge changes when volatility changes.
- Charm — how much the hedge changes as time passes.
Because dealers are very large, their combined hedging flows become a market force in themselves. Dealer positioning makes that force visible.
The Market Gamma Index: dampening or amplifying?
The most important metric is the aggregated net gamma across all open options — our Market Gamma Index (net-GEX). Its sign determines the entire behaviour of the market:
- Positive gamma (long gamma): dealers are volatility-reducing. When the price rises they sell; when it falls they buy. This dampens moves — the market tends toward tight ranges, mean reversion and "pinning" to large strikes.
- Negative gamma (short gamma): dealers are volatility-amplifying. They buy into rising prices and sell into falling ones — they reinforce the trend. Moves get bigger and volatility rises.
The tipping point between the two regimes is the zero-gamma flip: the price level at which net gamma switches sign. If spot is near the flip, the regime can tip at any time — an important warning signal for heightened fragility.
This two-regime logic is not our invention. The practitioner term "GEX" comes from an industry white paper (2016). Academically, the sign regime is backed by "Gamma Fragility" by Barbon & Buraschi (2021): they show that aggregate dealer gamma imbalances explain intraday momentum (under negative gamma) and reversal (under positive gamma) — and that the effect is strongest in illiquid conditions.
Call wall, put wall and the strongest pin
From gamma per strike we can derive notable reference levels:
- Call wall — the strike above spot with the largest positive net dealer gamma. Often acts as a resistance reference.
- Put wall — the strike below spot with the largest negative net gamma. Often acts as a support reference.
- Absolute gamma — the strike with the largest gamma magnitude overall, the most "magnetic" pin.
Important: these walls are references, not barriers. There is no guarantee the price turns at them. They only show where hedging activity is densest.
The idea that prices are drawn to large strikes (pinning) is one of the best-documented observations in market microstructure. Ni, Pearson & Poteshman (2005, Journal of Financial Economics) showed that closing prices of optionable stocks cluster at strike prices on expiration day — an average shift of about 16.5 basis points, aggregated over roughly 9 billion dollars of market capitalization. Golez & Jackwerth (2012, JFE) extended this pinning finding to the S&P 500 future — precisely the index level our SPY and QQQ walls operate on.
Vanna and charm: the engine of the pre-OPEX drift
This is where the loop back to seasonality closes. Vanna and charm explain why the market so often drifts higher before the big monthly expiry.
The typical mechanism: investors and institutions buy index puts as protection, so dealers are net short puts. Two things then happen:
- Charm (time): as expiry approaches, the delta of out-of-the-money puts shrinks. The dealer needs less short protection and buys shares back.
- Vanna (volatility): if the market stays calm, implied volatility falls. That also shrinks put delta — the dealer buys back too.
Both forces push dealers to buy in the same days — a mechanical upward bid into the third Friday that often accelerates on Thursday/Friday. After expiry this stabilizing positioning disappears, the hedge cushion falls away — and the market becomes more directional and volatile (the notorious post-OPEX volatility).
There is hard evidence for this too. Baltussen, Terstegge & Whelan (2024) document a "Third Friday Price Spike": over 2003–2021 the opening print on the third Friday averaged 18.5 basis points above the prior close (t-statistic above 4.5); the effect is charm-driven and strongest on triple-witching days. The estimated wealth transfer in the SPX alone: about 4 billion dollars per year.
A complementary metric is skew — the difference between the implied volatility of an out-of-the-money put (90%) and an out-of-the-money call (110%). A steep put skew signals elevated hedging demand and is one building block of the vanna flows.
The SeasonAlpha angle: seasonality meets dealer flows
There are many gamma providers, and there are many seasonality sites. But nobody marries the two. That is exactly where our edge lies.
GEX providers show the flow in the now. Seasonality sites show the calendar pattern on average. SeasonAlpha has both — plus an exchange-accurate calendar for OPEX, triple witching, VIXpiration and the trading-day-of-month (TDOM). That lets us say why a seasonal pattern exists, instead of just showing it.
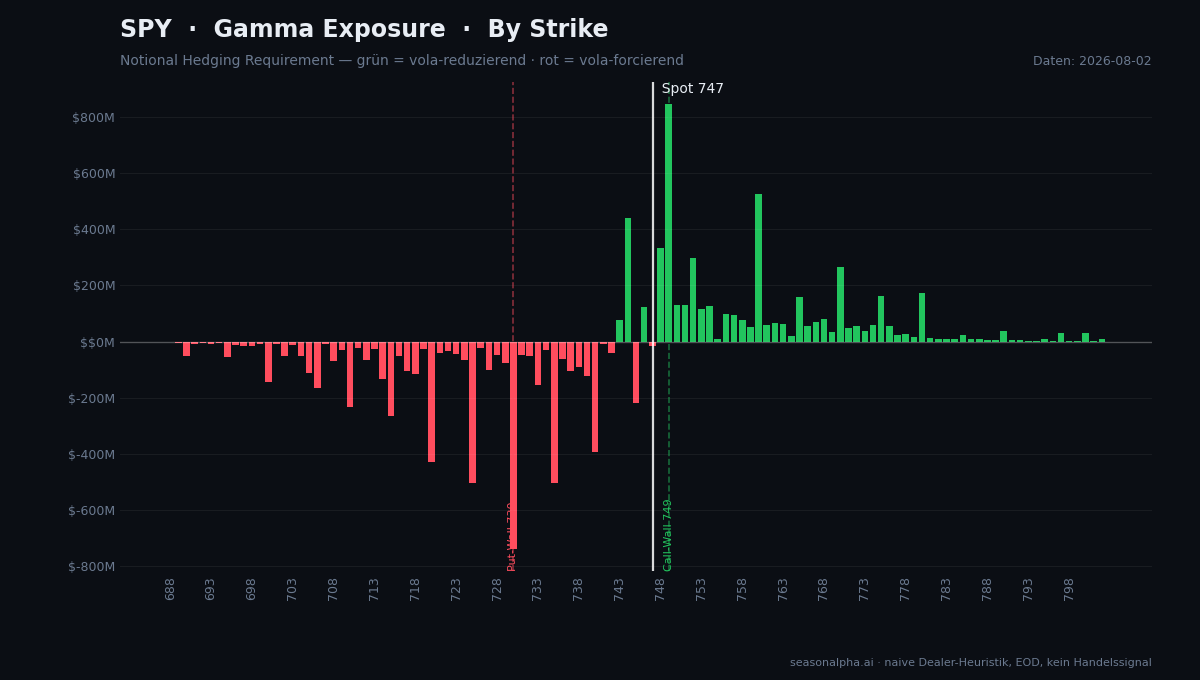
The chart shows the gamma exposure of SPY by strike — exactly what our dealer positioning page computes daily. Green bars mark strikes where dealer hedging is stabilising (price gets pulled in), red ones destabilising. Where the calendar marks monthly expiry dates, gamma, charm and vanna provide the mechanical explanation for the recurring pre-OPEX drift — and for the volatility spikes afterward.
That is how "pattern" becomes "mechanism". For retail investors it means: you not only see that a phase is statistically notable, you understand the structural cause behind it — and can better judge when a pattern is robust and when macro events override it.
Limits: what our numbers are — and what they are not
When real money is on the line, we put the limits on the table rather than faking precision:
- We use a naive dealer heuristic. Assumption: dealers are long calls and short puts. This is a proven first approximation for index gamma, but not actual knowledge of dealer books.
- We compute on EOD data from Yahoo (open interest and implied volatility at the close). Commercial providers use proprietary inventory models with intraday and 0DTE data. Our numbers differ from theirs — they are a solid approximation, not identical.
- Walls are references, not guarantees. No buy or sell signal, no investment advice.
These limits are not a flaw but part of the method. Anyone taking dealer positioning seriously needs to know how reliable the underlying data is.
How to use the feature
You will find the new feature on the Dealer Positioning page. There you see, for the most important US underlyings (SPY, QQQ and large single names), the Market Gamma Index, the zero-gamma flip, the call and put walls, and the vanna/charm picture.
The most value comes from combining it with the calendar: look at the dealer picture in the week before options expiry, and check VIXpiration to place the volatility cycle. That way you connect the seasonal pattern with the mechanism driving it.
One note on interpretation: single-stock gamma is far noisier than index gamma, because dealers are less dominant there. For robust reads, the large index ETFs (SPY, QQQ) are the best starting point.
Conclusion
Dealer positioning is not a crystal ball but an explanatory layer. Gamma tells you whether dealers dampen or amplify moves. Vanna and charm explain the mechanical upward drift into expiry and the volatility afterward. And the walls mark where hedging activity is densest.
The real value appears when you combine this mechanism with our seasonal calendar — then a statistical pattern turns into an understood relationship. Try it yourself at seasonalpha.ai/dealer-positioning.
Frequently Asked Questions
What do positive and negative gamma mean?
Positive net gamma (long gamma) means dealers dampen market moves — they sell into strength and buy into weakness, so the market tends toward tight ranges. Negative gamma (short gamma) means the opposite: dealers amplify moves and volatility rises.
Are the call wall and put wall fixed price barriers?
No. They are reference strikes with the highest hedging activity, where prices react more often. But they are not a guarantee and not a trading signal — strong news or macro events override the picture at any time.
Why does the market often rise before options expiry?
Because dealers who are net short puts have to buy back their short hedges due to time decay (charm) and falling volatility (vanna). That creates mechanical buying pressure into the third Friday. Studies such as Baltussen et al. (2024) document the effect at around 18.5 basis points.
Are your numbers the same as commercial providers's?
No. We use a naive dealer heuristic on EOD data, not proprietary inventory models with intraday and 0DTE flows. Our values are a solid approximation for the overall picture but differ in detail.