Midterm elections and the stock market: the weeks around November 3
On November 3, 2026, Americans elect the entire House of Representatives and a third of the Senate. Two rules of thumb circulate around the date: "buy the election" and "sell the election". We checked how the S&P 500 moved across 31 midterms from 1898 to 2022 (as a back-calculated series before 1957), from 20 trading days before election day to 20 trading days after.
The headline number: in the 20 trading days after a midterm, the index gained +0.56% on average (all 31 elections). The comparison with non-election years uses only the 30 elections for which both comparison years exist: there it is +0.72% against +0.39% in the same weeks without an election, a gap of +0.33 percentage points. The larger difference shows up in the run-up, the weeks before the vote.
Every figure in this article comes from a frozen data snapshot (prices through October 6, 2026). You can check them on the Elections and Markets page at exactly this snapshot; the live view uses the latest prices.
How the study is set up
For each midterm we define a reference point, t0: the last close on or before election day. The NYSE now trades on election day, so t0 is that day's close. Polls close in the evening; price moves after election night show up in the next session, and the final result can take longer.
From t0 we count 20 trading days back and 20 forward, roughly four market weeks each way today. All figures are percentage changes, never point differences: the post-election return runs from t0 to t+20, the run-up from t−20 to t0. The first chart sets t0 to 0%. That puts 1898 and 2022 on the same scale.
Two caveats for the early years: the S&P 500 in its current form dates from 1957, and earlier values are a back-calculation. And until 1952 the NYSE also traded on Saturdays, so 20 trading days were a little over three weeks back then.
One election is missing: 1914. The exchange closed for months after war broke out in Europe, and there is no price anywhere near election day. That leaves 31 usable midterms.
The comparison with non-election years
An average on its own says little. A positive number after election day may simply reflect the time of year: in the same weeks of non-election years, the index also rose on average. We therefore pair each midterm with the two adjacent odd-numbered years, when no federal election took place. The same calendar rule applies (the Tuesday after the first Monday in November), and the same window is measured. There are 30 complete triples of one election year and two comparison years.
The difference from those comparison years shows how much election years differed from ordinary years in these weeks. Whether the election caused that difference cannot be shown this way.
After election day: slightly positive, barely different from no election
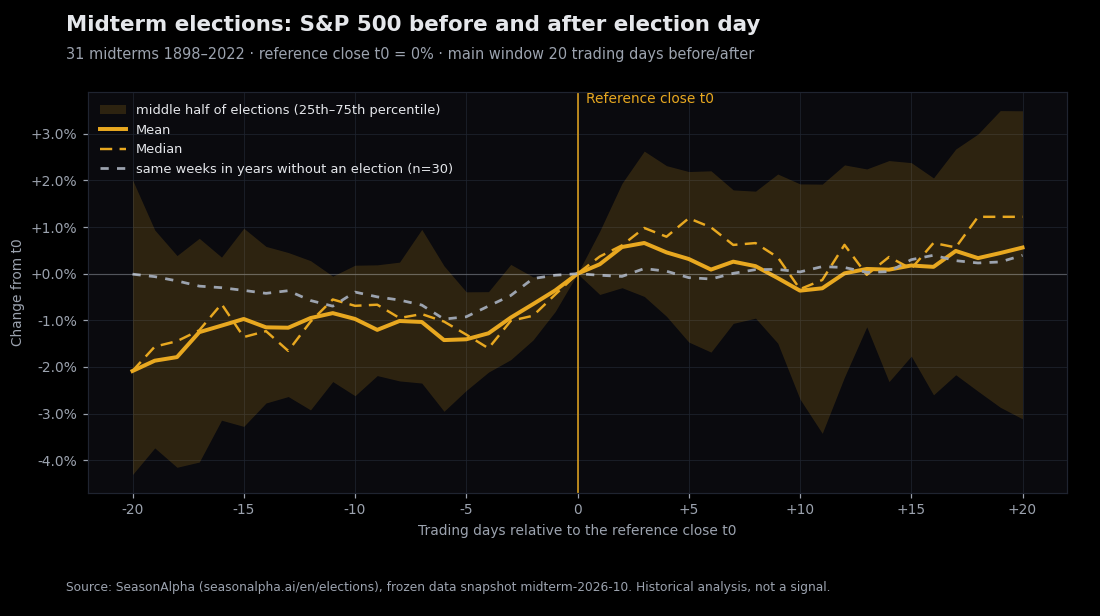
The chart shows all 31 midterms, each set to 0% at the reference close t0. Left of t0 is where the index stood before the vote, right of t0 is where it went afterwards. The solid gold line is the mean, the dashed one the median. The shaded band covers the middle half of elections (25th to 75th percentile), and the grey line traces the same weeks in non-election years. The gold lines use all 31 elections, the grey line the 30 complete triples, so the gap between the lines is not exactly the paired difference below.
To the right of t0 the mean hovers near zero and dips slightly below it along the way. After 20 trading days it stands at +0.56%, the median at +1.22%. In 20 of 31 cases (64.5%) the index was above the election-day close four weeks later.
The spread dwarfs the average. The middle half of elections runs from −3.11% to +3.49%. The extremes:
| Midterm | 20 trading days after the election |
|---|---|
| 1962 | +6.92% |
| 1954 | +6.92% |
| 1974 | −10.25% |
1974 fell into a bear market with an oil shock and a recession; 1962 came in the weeks after the Cuban Missile Crisis. How much of these outliers came from the market backdrop and how much from the election cannot be separated from prices alone.
In the paired comparison of 30 triples, midterm years made +0.72% and non-election years +0.39% over the same window. The midterm-year edge: +0.33 percentage points, small next to a spread of several percent per election.
The bigger gap comes before election day
Left of t0 the chart looks different. The mean rises through the four weeks before the vote while the grey comparison line stays flat.
From t−20 to t0 (n = 30 triples):
- Midterm years: +2.63%
- Same weeks without an election: +0.30%
- Difference: +2.33 percentage points
- 20 of 30 midterm years were up during the run-up
The observed difference sits in October more than in November. A common explanation is that uncertainty about the outcome fades as polling makes the result more predictable. Price data alone cannot confirm that mechanism.
Since 1971: practically no difference after the vote
18 of the 31 windows fall before 1971. For that era the exchange calendar is not fully documented: until 1968 the NYSE closed on election day every year, and there were additional special closures. The page flags these windows. Restricting the sample to the 13 midterms since 1971 changes the post-election picture:
| Since 1971 (n = 13) | Midterm year | No election | Difference |
|---|---|---|---|
| 20 trading days after, mean | +1.00% | +0.94% | +0.06 pp |
| 20 trading days before, mean | +4.95% | +0.47% | +4.48 pp |
After the vote, the index rose +1.00% on average since 1971, +2.17% at the median, and was up in 10 of 13 cases (76.9%). That reads well until you look at non-election years: +0.94%. A gap of +0.06 percentage points is effectively zero: since 1971, the weeks after a midterm have on average moved almost exactly like the same weeks without an election.
The run-up holds up in the shorter sample: +4.95% against +0.47%, positive in 10 of 13 years.
Presidential elections and the Dow for comparison
The same paired calculation for other elections and indexes produces similarly small post-election gaps:
- S&P 500 at presidential elections (32 complete triples): +0.49% after, against +0.17% without an election, a difference of +0.32 pp
- Dow Jones at midterms (30 triples): +0.85% after, against +0.68%, a difference of +0.17 pp
None of these series shows a post-election edge above half a percentage point.
When control of the House changes
The obvious next question is whether the outcome matters. Splitting the 31 midterms by whether the House majority flipped gives:
| House majority | n | 20 trading days after, mean | positive |
|---|---|---|---|
| flipped | 10 | −1.02% | 40% |
| held | 21 | +1.31% | 76% |
This split uses hindsight. On election day nobody knew for certain whether the House would flip, and a rule that requires the result in advance cannot be traded. Ten cases are also far too few to turn −1.02% into a reliable difference.
Where 2026 stands right now
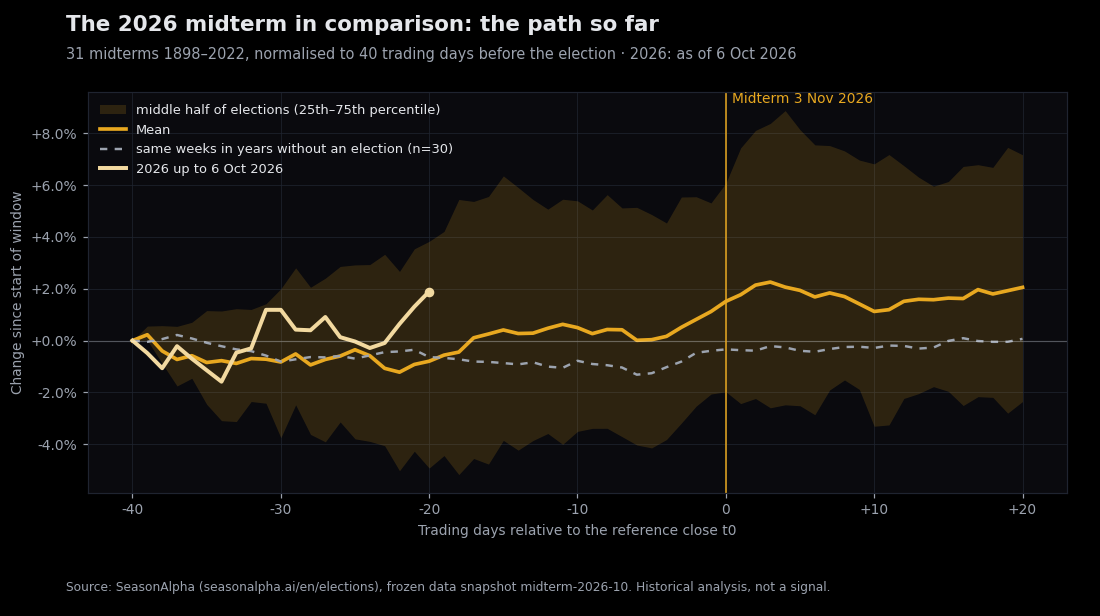
The second chart starts earlier: 40 trading days before the election = 0%. For 2026 that is September 8, 2026. The light gold line traces this year through the last close on October 6, 2026, which is 20 trading days before election day.
Since September 8 the S&P 500 is up +1.89%. The historical mean at the same point was −0.80%, with the middle half of elections between −4.92% and +3.83%. 2026 is running above the average but well inside the range covered by half of all midterms.
The chart says nothing about the coming weeks. The historical paths to the right fan out widely.
Why there is no p-value here
This study has no significance test. With 31 elections, only 13 since 1971, and a November that carries calendar effects of its own, a p-value would suggest precision the data cannot deliver. What a p-value does and where it runs out is covered in Is the effect real? The p-value on six of our own measurements.
The numbers here describe what happened. They do not estimate how likely a pattern is to repeat.
What this means for investors
- "Sell the election" finds no support in the data. After election day the index rose more often than it fell, roughly in line with ordinary November weeks. "Sell" in this rule of thumb means exiting existing positions, not short selling.
- "Buy the election", read as buying on election day, has historically done barely better than buying in the same week of a non-election year. The midterm-year edge sat in the weeks before.
- Single years vary enormously. The range from +6.92% to −10.25% after four weeks is far wider than any average difference in this article.
For the bigger picture: how the full midterm year behaves in the presidential cycle is covered in Midterm Election Year 2026: After the Low Comes the Recovery. Typical midterm-year pullbacks are in the midterm drawdown article, and the basics of the four-year rhythm in the presidential cycle tutorial.
Conclusion
The weeks after a midterm election: across all 31 elections slightly positive on average (+0.56%), up in nearly two out of three cases. In the paired comparison of 30 triples it is +0.72% against +0.39% without an election, a gap of only +0.33 percentage points, and practically level since 1971. The difference from non-election years shows up mainly in the run-up, at +2.33 percentage points.
Neither "buy the election" nor "sell the election" holds up as a rule in these numbers. With 20 trading days to go, 2026 sits above the historical mean and within the usual range. The page Elections and Markets (snapshot midterm-2026-10) shows the exact data behind this article.
Frequently asked questions
Does the stock market rise after a midterm election?
On average, slightly: +0.56% over the 20 trading days after election day, positive in 20 of 31 midterms since 1898. In the paired comparison it is +0.72% against +0.39% in the same weeks without an election. Since 1971 the gap is +0.06 percentage points, effectively zero.
When is the 2026 midterm, and what is t0?
The vote is on Tuesday, November 3, 2026. The reference point t0 is the last close on or before election day, so in 2026 the close of November 3. Price moves after election night show up in the next session; the final result can take longer.
Does it matter which party wins?
When the House majority flipped, the index stood at −1.02% on average after 20 trading days (n = 10); when it held, at +1.31% (n = 21). That is a hindsight filter on very few cases, not a rule anyone could have acted on at the close on election day.
Where can I see the current numbers?
On /en/elections. /en/elections?snapshot=midterm-2026-10 shows exactly the data behind this article.