Do stock prices really cling to certain levels?
On options expiration day, something strange happens again and again: many stocks close suspiciously close to "round" option prices — the so-called strikes. This phenomenon is called pinning, and it is not a market myth. It has been documented in the leading finance journals for more than 20 years.
As early as 2005, Ni, Pearson and Poteshman showed in the Journal of Financial Economics that the closing prices of optioned stocks are measurably pulled toward strike prices on expiration day. In this article we explain why this happens, how to read the call wall and put wall — and, just as important, where the limits of these metrics lie.
What is pinning? The mechanism behind the "clinging"
Pinning arises from the hedging behavior of market makers — the "dealers." When you trade an option, a dealer is on the other side, and they do not want to carry directional risk. They continuously neutralize their exposure in the underlying. This is called delta hedging.
The closer expiration gets, and the closer the price sits to a heavily traded strike, the more sensitive this delta becomes. Even small price moves force the dealer to buy or sell shares — and they do so against the move. If the price rises above the strike, they sell; if it falls below, they buy. This counter-trading acts like a rubber band that keeps pulling the price back toward the strike.
Avellaneda, Kasyan and Lipkin turned this feedback effect into a mathematical model in 2011. Their core result in one sentence: the probability of pinning rises with the open interest at a strike — and falls the easier it is to move the price (price impact). Put simply: lots of open interest plus low liquidity produces a strong pin.
Call wall and put wall: how SeasonAlpha defines the "walls"
From the aggregated dealer gamma per strike, we derive three reference strikes. They show where hedging activity is most concentrated:
- Call wall — the strike above the current price with the largest positive net dealer gamma. Often acts as a resistance reference.
- Put wall — the strike below the price with the strongest net gamma on the hedging side. Often acts as a support reference.
- Absolute gamma strike — the strike with the largest overall gamma magnitude. This is the "most magnetic" pin, whether above or below the price.
On top of that comes the zero gamma flip: the price level at which aggregated net gamma changes sign — the boundary between dampening and amplifying dealer behavior.
A concrete, clearly dated example: on 2 August 2026, the SPY call wall sat at 749, the put wall at 730, and the zero gamma flip at roughly 748 — with the price near 747. SPY was clinging just below the call wall and the zero gamma flip. This is a snapshot, not a forecast: these values shift daily with open interest.
What the research shows — and how strong it is
We have since measured the effect on our own data: 158 stocks, 369 calendar months, 1996 to 2026. The numbers, and a surprising development since 2010, are in Pinning on Expiration Day.
Pinning is one of the best-documented observations in market microstructure. Three works form the foundation — two of them in the Journal of Financial Economics, one of the three most respected finance journals in the world.
| Study | Level | Core finding |
|---|---|---|
| Ni, Pearson & Poteshman (2005), JFE | Single stocks | Closes cluster at strikes; ~16.5 bps return shift, ~$9bn aggregated |
| Golez & Jackwerth (2012), JFE | Index / future | S&P 500 future pins to the ATM strike; ≥ $115m notional per expiry |
| Avellaneda, Kasyan & Lipkin (2011) | Model | Pinning probability ∝ open interest ÷ price impact |
Single stocks: Ni, Pearson & Poteshman (2005)
The canonical study. It examined thousands of US stocks with exchange-listed options and found clear clustering of closing prices at strikes on expiration. The measured return effect averaged around 16.5 basis points — aggregated across roughly $9 billion in market capitalization. The authors attribute this to market makers' hedge rebalancing and, in part, to deliberate influence by large option traders.
Index level: Golez & Jackwerth (2012)
Seven years later, Golez and Jackwerth extended the finding to the S&P 500 future — exactly the index level on which our SPY and QQQ walls operate. At the expiration of serial options, the future is drawn to the nearest at-the-money strike; the notional shift is at least $115 million per expiry. Intriguingly, they also found a counterpoint: just before index option expiration, the price is sometimes pushed away from the strike (anti-cross-pinning). A clear reminder that pinning is no simple, permanent magnet.
The model: Avellaneda, Kasyan & Lipkin (2011)
They supplied the theory to match the evidence: a feedback model in which the option hedging flow moves the price — and the price in turn moves the hedging flow. Pinning is therefore not a coincidence but a natural consequence of concentrated open interest. That very concentration is what our walls map.
The seasonal frame: the expiry cycle repeats every month
Pinning is a calendar event. The big monthly options expiration always falls on the third Friday, and four times a year — in March, June, September and December — it coincides with the expiry of index futures and index options (triple witching). That is when open interest is largest, and precisely where pinning and wall effects tend to be strongest.
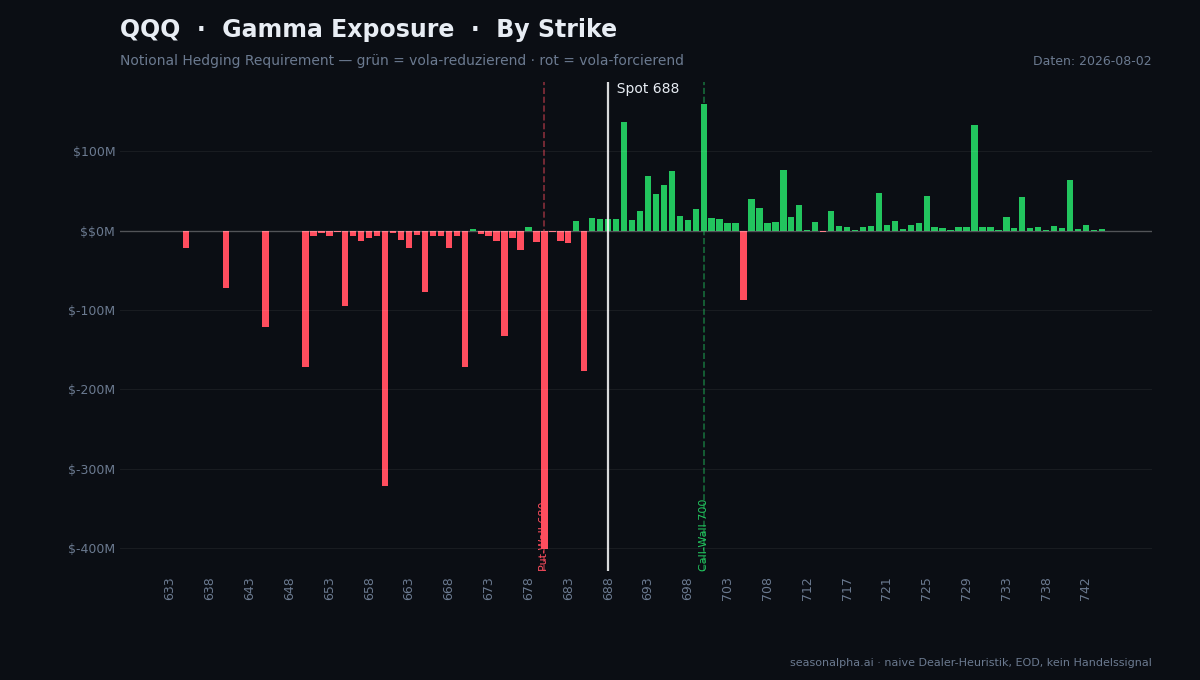
The chart shows the gamma exposure of QQQ by strike on a sample day. The tallest positive bars (green) above the price form the call wall, the deepest negative ones (red) below form the put wall — between them sits the pin zone where price tends to "cling" into expiration. Live and updated daily for every underlying on our dealer positioning page. That is the interplay: the calendar delivers the pattern, dealer positioning delivers the mechanism beneath it.
For retail investors this means a wall strike is never an isolated number. It carries the most weight around the four triple-witching dates, when the bulk of open interest piles up at the same strikes.
Limits and counterexamples: what walls are NOT
When real money is on the line, we are transparent here rather than faking a precision the data cannot support:
- Walls are concentration references, not barriers. There is no guarantee the price turns at them. They only mark where hedging activity is densest — not a buy or sell signal.
- The effect is statistical and small. 16.5 basis points is an average across thousands of cases, not a tradable single-day swing. Pinning explains a tendency, not an individual move.
- Prices can also be pushed away. Golez and Jackwerth documented anti-cross-pinning before index expirations. The "magnet" can reverse.
- We use a naive dealer heuristic (assumption: long calls, short puts) on end-of-day Yahoo data — open interest and implied volatility at the close. Commercial providers use proprietary inventory models including intraday and 0DTE data. Our numbers differ from theirs; they are a solid approximation, not a picture of real dealer books.
These limits are not a flaw but part of a sound method. Anyone who takes walls seriously needs to know how reliable the data behind them is.
How to read the call wall and put wall in practice
You will find the feature on the Dealer Positioning page. For the most important US underlyings, it shows the current price relative to the call wall, put wall, absolute gamma strike and zero gamma flip. As a rule of thumb: when the price sits between the put wall and the call wall, a tighter trading range is more likely; as it approaches a wall, attention rises for a possible reaction — with no guarantee.
You get the most value in combination with the calendar. In the week before options expiration, check the wall picture and pay special attention to the four triple-witching dates. That way you connect the seasonal pattern with the mechanism driving it. If you want the groundwork on gamma, vanna and charm, see our post Dealer Positioning Explained.
One note on interpretation: single-stock gamma is far noisier than index gamma, because dealers are less dominant there. For robust reads, the large index ETFs SPY and QQQ are the best starting point.
Conclusion
Pinning is not superstition but one of the best-documented observations in market microstructure — from single stocks (Ni, Pearson & Poteshman) to the S&P 500 future (Golez & Jackwerth) to the model (Avellaneda, Kasyan & Lipkin). The call wall and put wall make visible where open interest piles up and dealer hedging is densest.
But: walls are references, not barriers. The effect is real yet small, and our numbers are a solid approximation on end-of-day data, not an insider's view of dealer books. That is precisely where the value lies — you get a well-grounded orientation, not a false promise. Try it yourself at seasonalpha.ai/dealer-positioning.
Frequently Asked Questions
What is options pinning in simple terms?
Pinning describes the tendency of stock prices to close near a heavily traded strike on options expiration day. The cause is market makers' delta hedging, which pulls the price back toward the strike like a rubber band. The effect is documented, among others, by Ni, Pearson & Poteshman (JFE 2005).
What is the difference between a call wall and a put wall?
The call wall is the strike above the price with the largest positive net dealer gamma and often acts as a resistance reference. The put wall sits below the price and often acts as a support reference. Both mark zones of high hedging activity, but neither is a fixed barrier.
Are call walls and put walls reliable trading signals?
No. They are concentration references, not guarantees, and not a buy or sell signal. The pinning effect is small on average (around 16.5 basis points), and strong news or macro events can override the picture at any time. Use walls for orientation, not as a trigger.
Why are pinning effects stronger on triple-witching days?
Because in March, June, September and December, the expiry of stock options, index options and index futures coincides. Open interest is then at its largest, and the more open interest sits at a strike, the stronger the pinning probability, according to Avellaneda et al. (2011).