The last week before the election was usually a good week
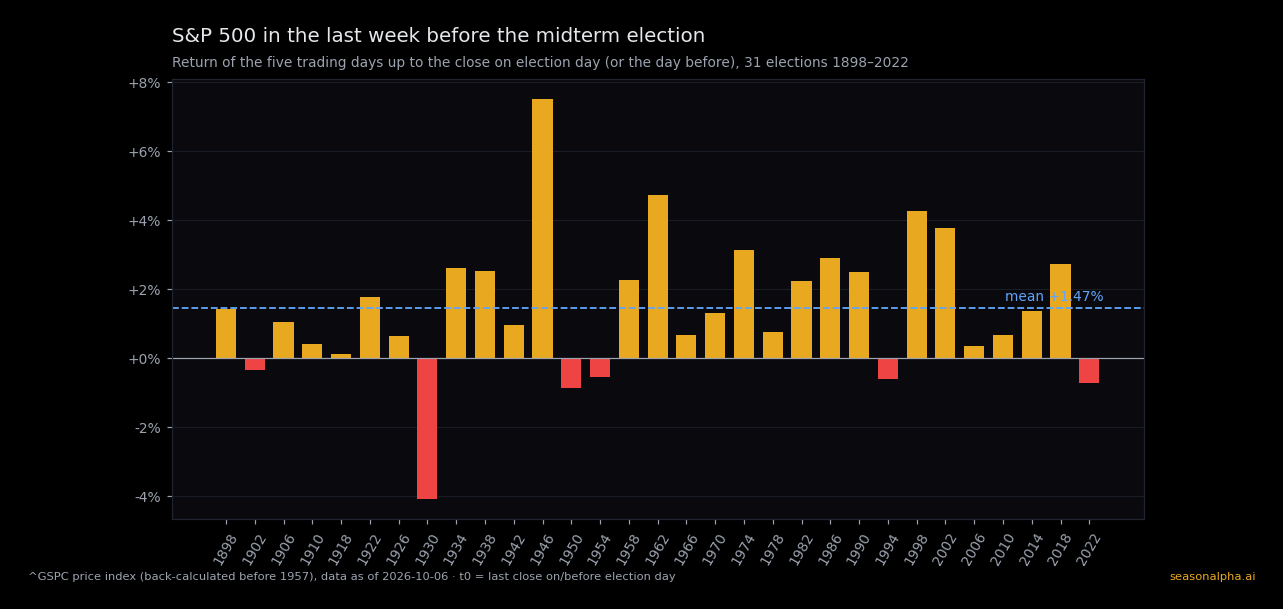
On Tuesday, November 3, 2026, the US elects the House of Representatives and a third of the Senate. How did the S&P 500 do in the five trading days before earlier midterm elections? Across 31 midterms from 1898 to 2022 the last week averaged +1.47% and was positive in 25 of 31 election years. The median is +1.32%.
The same days in the two neighbouring years without an election averaged +0.79%. Comparing each election year directly with its neighbours, the last week gives +1.47% against +0.79%, a gap of +0.68 pp, and in 20 of 31 cases the election year came out ahead.
This is a historical pattern from few cases, not a forecast for 2026. Below: how the week is measured, how it went day by day, and where the limits of the numbers are.
How the week is measured
For each election we set a reference point t0: the last close on or before election day. Since 1970 the New York Stock Exchange has been open on midterm election days, so t0 is the close of election day itself – before the first results are known. Until 1966 it was closed on election day, so t0 is the close of the trading day before. t0 fell on election day in 14 of 31 cases.
The last week is the return from the close five trading days before t0 to the close of t0, that is five daily returns. In 2026 this window runs from the close on October 27 to the close on November 3. We also show each of these daily returns and the first trading day after election night (t+1).
The comparison without an election uses, for each midterm year, the two adjacent odd years with a stand-in date on the first Tuesday after the first Monday in November, the same spot in the calendar. This compares the election week with the same time of year without an election. Both comparison years are available for all 31 elections.
Returns are percentage changes of the price index, without dividends. The figures come from the same frozen data set as our article on the weeks around midterm election day (prices through 2026-10-06). The 1914 election is missing because the exchange was closed for months after the outbreak of war.
The week in numbers
| 31 midterms 1898–2022 | 13 midterms 1974–2022 | |
|---|---|---|
| Mean | +1.47% | +1.79% |
| Median | +1.32% | +2.24% |
| positive | 25 of 31 | 11 of 13 |
| best week | +7.50% (1946) | +4.27% (1998) |
| worst week | −4.09% (1930) | −0.73% (2022) |
| same days without an election (mean) | +0.79% | +1.22% |
| difference election year vs. no election | +0.68 pp | +0.57 pp |
The right column contains only elections from 1971 on, for which our exchange calendar is verified. For the elections since 1971 the mean is somewhat higher at +1.79%, but the years without an election are higher too: the gap is +0.57 pp, and the election year came out ahead in 9 of 13 cases.
The last week was negative in six election years, clearly so only in 1930, in the middle of the Great Depression. The most recent negative week was 2022 at −0.73%.
Day by day
| Day | Mean election year | Positive | Mean without election | Difference |
|---|---|---|---|---|
| t−4 | +0.14% | 18 of 31 | −0.02% | +0.16 pp |
| t−3 | +0.35% | 19 of 31 | +0.08% | +0.27 pp |
| t−2 | +0.30% | 19 of 31 | +0.62% | −0.32 pp |
| t−1 | +0.30% | 22 of 31 | +0.17% | +0.13 pp |
| t0 (reference day) | +0.37% | 23 of 31 | −0.05% | +0.42 pp |
| t+1 (day after the election) | +0.20% | 20 of 31 | −0.14% | +0.35 pp |
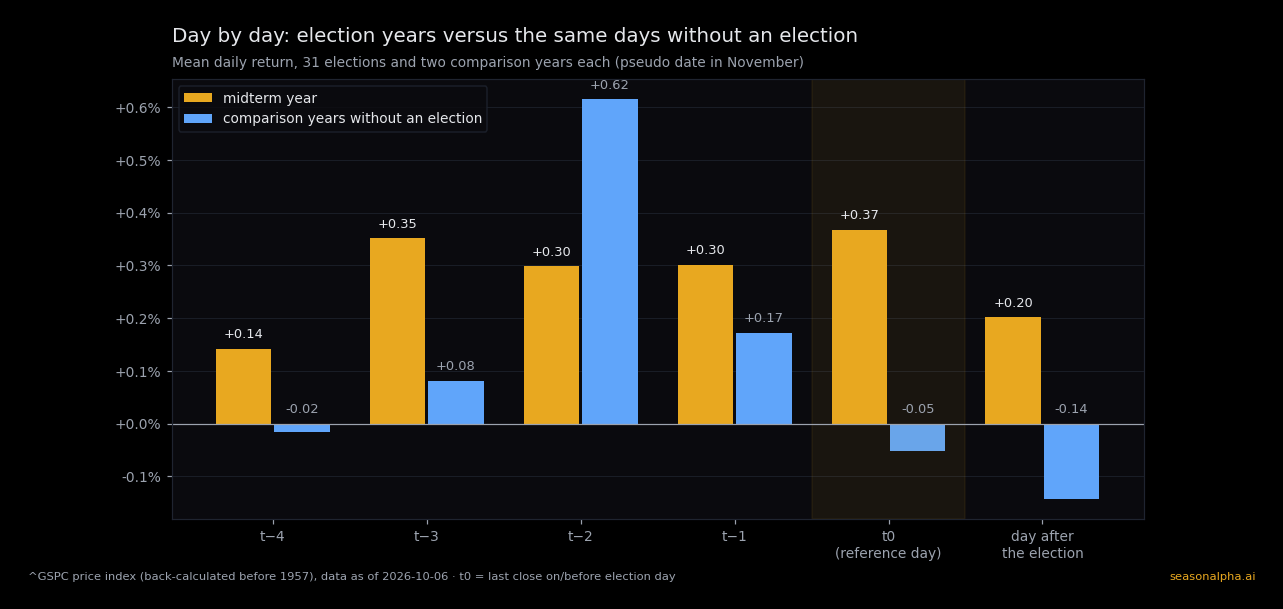
In election years each of the five days was positive on average, most often the last two: the day before t0 in 22 of 31 cases, t0 itself in 23 of 31. Note: t0 has only been election day since 1970, before that it was the trading day before. On the 14 election days on which the exchange was open, the daily return averaged +0.44%, positive in 10 of 14 cases. The lead over the years without an election is spread across four of the five days; only at t−2 were the comparison years ahead, at +0.62% on average.
Single-day means over 31 cases swing a lot; one unusual day in a single year moves them by several hundredths. The t+1 row shows the first trading day after election night and is no longer part of the week before the election.
How the week fits the bigger picture
Our article on the weeks around election day measures 20 trading days before the election. Over those 20 trading days, in the paired comparison, the election year leads the years without an election by +2.33 pp, based on 30 complete comparison groups. The last week contributes part of that; the larger part comes from the weeks before. The two numbers come from different windows and slightly different case counts: in the longer window the 1930 election drops out because the frozen data set marks the path of one of its comparison years (1929) as invalid after the election.
After the election, from t0 on, the difference to the years without an election was small in the longer window. That suggests the pattern shows up mainly in the run-up to the election – these data do not explain why.
Limits of the numbers
- 31 cases. Each election is one data point, and there are no more than 31. A single year like 1946 (+7.50%) moves the mean noticeably.
- No p-value. We deliberately fixed a single window and did not search for the most favourable one. A test on a window that could have been picked from many would still promise more certainty than 31 cases provide. Why is explained in our article on the p-value.
- Early years differ. Before 1957 the S&P 500 is a back-calculation; until 1952 there was Saturday trading, so five trading days were less than a calendar week. Until 1966 the week ends on the day before the election.
- No cause. The numbers show what the index did on these days, not why. The comparison years without an election are also positive on average on these days (+0.79%): positive returns in this window occurred in years without an election too.
What this means for 2026
For the current election the measured week starts with the close on October 27 and ends with the close on election day, November 3. How 2026 compares with earlier elections is shown on the elections and the stock market page with the latest prices.
Historically the last week before a midterm election was positive in most years and somewhat stronger than the same days without an election. That describes 31 cases, it is not a signal for the coming days – and how much 2026 differs will only be known on the evening of November 3.
The full cycle of the midterm year is covered in our article on the 2026 midterm year.
Frequently asked questions
Does the S&P 500 rise in the week before the midterm election?
Mostly: in 25 of 31 midterm years since 1898 the S&P 500 was up over the last week before the election, by +1.47% on average. The same days without an election averaged +0.79%.
How does the market behave on election day itself?
Since 1970 the exchange has been open on midterm election day. On these 14 open election days the S&P 500 rose by +0.44% on average, positive in 10 of 14 cases. Across all 31 elections, with the day before as t0 until 1966, the return on the reference day t0 was +0.37%.
What happens the day after the election?
On the first trading day after election night the S&P 500 rose by +0.20% on average and in 20 of 31 cases. What happened in the following weeks is covered in our article on the weeks around election day.
When does the last week before the 2026 election start?
It is measured from the close on Tuesday, October 27, 2026, to the close on election day, Tuesday, November 3, 2026.