VIXpiration April 2026: What Happens to the S&P 500 on VIX Expiration Day?
April 13, 2026 · 4 min read · SPY
What Is VIXpiration?
Every month, VIX options and futures expire at the CBOE — and not on the same day as equity options (OPEX). While the regular OPEX expiry takes place on the third Friday, the VIX settlement is calculated 30 calendar days beforehand:
Basis: Third Friday of the month (calendar)
VIX Settlement: Basis minus 30 calendar days → typically a Wednesday
Holiday rule: If the basis Friday or the settlement Wednesday falls on a NYSE holiday, settlement is moved forward by one trading day
For April 2026, this means:
Date
Event
04/17/2026 (Fri)
OPEX — Third Friday
04/15/2026 (Wed)
VIXpiration — VIX Settlement
04/14/2026 (Tue)
Last VIX trading day
Why Is This Relevant for Traders?
Systematic things happen around VIXpiration. Institutional traders and market makers must roll or unwind their VIX hedges. This creates measurable patterns — not just in the VIX itself, but also in the S&P 500.
On the new VIXpiration page we analyzed all VIX settlement dates over the past 21 years and measured SPY returns around the expiration day.
What Do the Data Show?
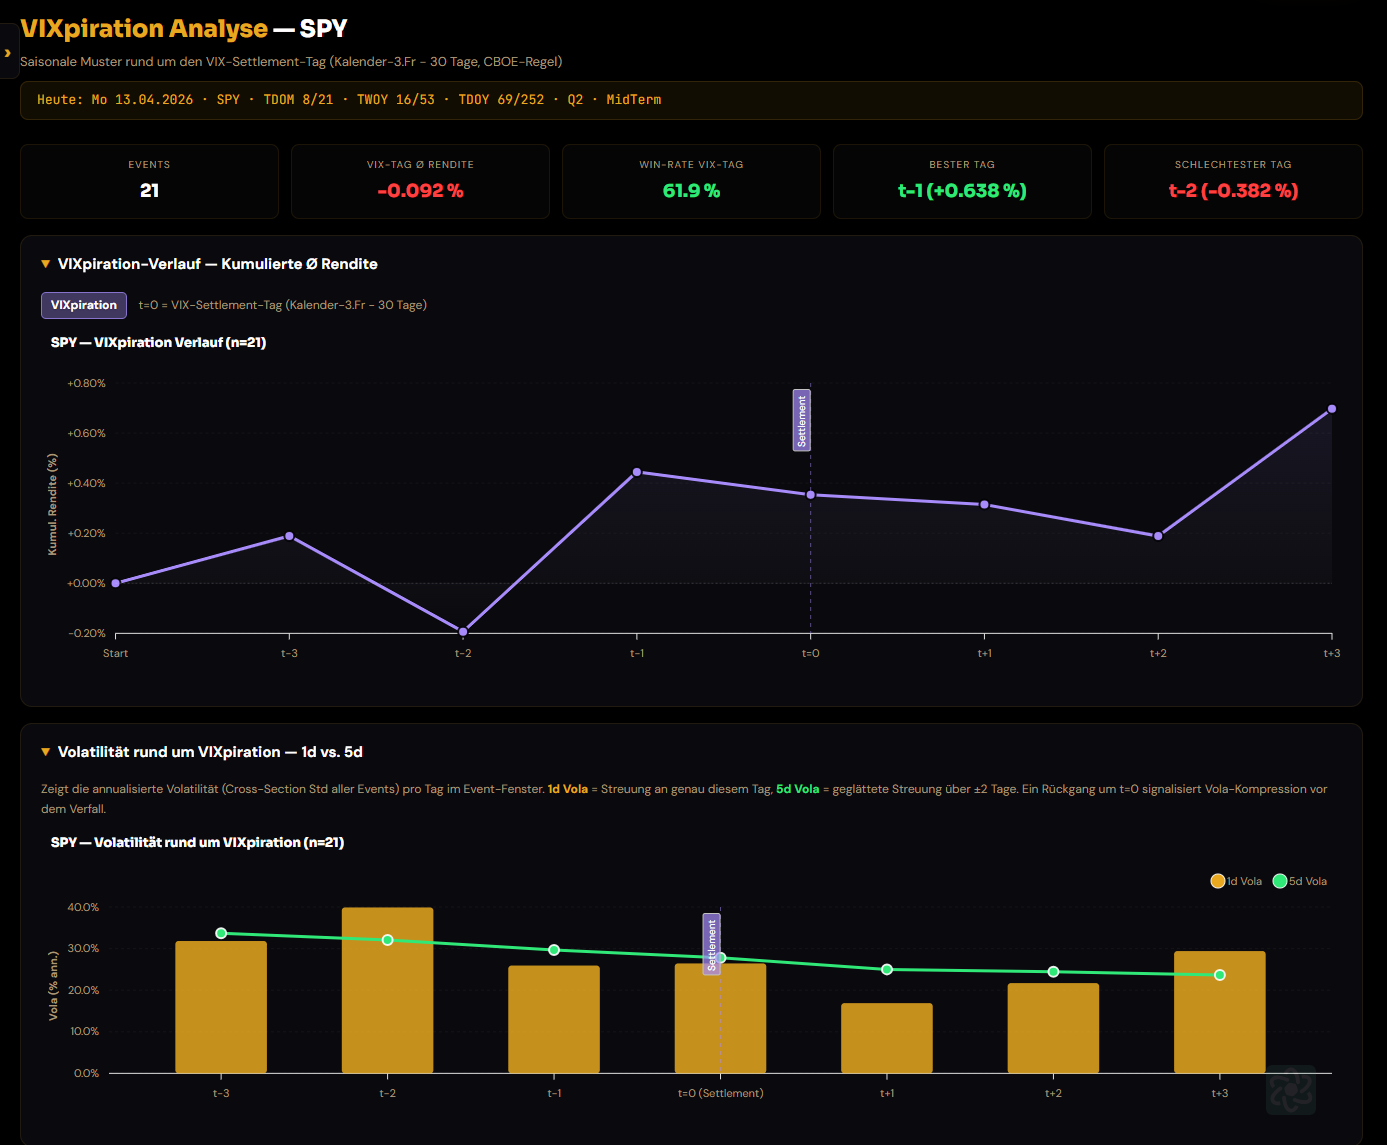
VIXpiration SPY chart — cumulative return and volatility around VIX expiry
The chart shows the average cumulative return path for SPY around VIXpiration (t=0). Some observations:
1. The Day Before Settlement (t-1) Is the Strongest
With an average return of +0.64%, the Tuesday before VIX settlement is historically the best day in the window. The win rate is just under 62%. This is not a coincidence — on Tuesday, the final VIX positions are rolled, and the unwinding of hedges creates buying pressure in the S&P 500.
2. The Day t-2 Is the Weakest
Two days before settlement — the Monday before — historically shows the greatest weakness at -0.38%. This is where position adjustments begin, and uncertainty about the settlement weighs on prices.
3. Volatility Drops on Expiration Day
The volatility chart below shows it clearly: the 1d volatility (gold bars) falls noticeably on settlement day (t=0) and in the following days. The 5d volatility (green line) confirms the trend on a smoothed basis. This is the classic volatility compression around expiry — uncertainty is resolved, hedges are wound down, the market calms.
4. Prices Tend to Rise After Settlement
From t+1, the trajectory turns upward. The cumulative return rises from +0.30% on settlement day to +0.68% three days later. The post-VIXpiration phase benefits from the gamma exposure of market makers declining and the market being free to move.
What Does This Mean for This Week?
The VIX expiry on Wednesday, April 15, 2026, is approaching. If the historical pattern repeats:
Monday 04/14 (t-1): Historically positive (+0.64% avg.) — but the strongest day is tight
Wednesday–Friday (t+1 to t+2): Historically quieter phase with an upward tendency
Of course, there are no guarantees. Current macro events can overlay the pattern at any time. But the statistical base of 21 years is solid enough to keep an eye on the VIX calendar.
Analyze It Yourself
On the new VIXpiration page you can examine the effect for any ticker and time period yourself — with heatmap, significance test, backtest, and streak analysis. The page also shows the complete VIX settlement calendar with the next 10 dates.
Analyse it yourself on SeasonAlpha
Interactive charts, AI forecasts and technical filters for 270+ tickers.
This article does not constitute investment advice or a recommendation within the meaning of the Securities Trading Act (WpHG). Not a financial analysis under § 34b WpHG.
All content is for informational purposes only and reflects the personal opinion of the author; it does not take into account individual investment objectives or financial situation.
Past performance, backtests and seasonal patterns are not a reliable indicator of future results. Trading in financial instruments carries significant risks, including the possible total loss of invested capital.
No guarantee of accuracy, completeness or timeliness. Use is at your own risk.
The author may hold positions in the financial instruments mentioned (potential conflicts of interest). Content may have been created with the assistance of AI.
Full legal notice
Disclaimer
The information contained in this article is for general informational and educational purposes only. It does not constitute investment advice, investment brokerage or a recommendation to buy or sell financial instruments within the meaning of the Securities Trading Act (WpHG).
The content does not constitute financial analysis within the meaning of § 34b WpHG. In particular, it does not meet the statutory requirements for ensuring the impartiality of financial analyses and has not been prepared as such.
In particular, the analyses, scenarios, price levels or probabilities presented do not constitute individual investment recommendations and are not to be understood as a specific call to action. They do not take into account the personal investment objectives, financial situation or risk tolerance of individual users and therefore do not constitute an investor-appropriate or investment-appropriate recommendation.
All content is based on publicly available data and own analyses, and exclusively reflects the personal opinion of the author at the time of publication. Individual advice is not provided and cannot be replaced by this content.
To the extent that content has been created or supported with the use of artificial intelligence (e.g. large language models), such content may be incomplete, incorrect or biased. AI-generated content does not constitute a reliable basis for investment decisions. Liability for decisions resulting therefrom is — to the extent permitted by law — excluded.
Past performance, backtests or seasonal patterns are not a reliable indicator of future performance. Financial markets are subject to significant fluctuations; trading in securities, derivatives or other financial instruments carries significant risks, including the possible total loss of invested capital.
No guarantee is given for the accuracy, completeness or timeliness of the information provided. Any liability for financial losses arising from the use of the content is — to the extent permitted by law — excluded.
The author may hold or intend to acquire positions in the financial instruments mentioned. This may give rise to conflicts of interest within the meaning of § 34b WpHG.
All decisions made on the basis of the information provided are made at your own risk.