"Sell in May and go away" — where does the saying come from?
The phrase traces back to Victorian London: wealthy Britons left the city in May and did not return until September — "buy back on St. Leger Day", a traditional horse race held in mid-September. During their summer absence, trading was sparse, markets were thin, and volatility was high.
What began as a lifestyle habit became an observation: the summer months deliver measurably lower returns on the stock market than the winter months. Today the effect is so well known that many investors assume it has been arbitraged away. The data say otherwise.
The Numbers: November–April vs. May–October
We analysed the S&P 500 from 1896 to 2026 — 130 years, all available trading days, normalised returns per year (each annual path starts at 100, percentage returns compound on top).
| Period | Avg. Return | Win Rate | Number of Years |
|---|---|---|---|
| November–April (Best Six Months) | +5.2 % | 70 % | 130 |
| May–October (Worst Six Months) | +1.4 % | 62 % | 130 |
| Difference | +3.8 percentage points | +8 PP |
The effect is real and has been stable across 130 years. The "good" six months deliver almost four times the return of the "bad" six months — while also posting a higher win rate.

In the seasonal annual path you can see the pattern immediately: a strong upward move from November through April, then a plateau with two drawdowns in May and September/October — before the rally reliably regains momentum at the start of November.
The Reality Check: Has the Effect Worn Off?
A common objection: "If everyone knows the effect, shouldn't it have disappeared?" We examined the last three decades separately:
| Decade | Nov–Apr | May–Oct | Difference |
|---|---|---|---|
| 1996–2005 | +3.9 % | +1.8 % | +2.1 PP |
| 2006–2015 | +5.8 % | +1.1 % | +4.7 PP |
| 2016–2025 | +6.1 % | +2.3 % | +3.8 PP |
The message: the effect has not disappeared. In the last two decades the spread was even wider than the long-run average. What has changed are the absolute return levels — not the seasonality pattern.
The Difficult Months in Detail
Within the "bad" six months, not every month is equally weak:
| Month | Avg. Return | Win Rate |
|---|---|---|
| May | +0.2 % | 60 % |
| June | –0.1 % | 55 % |
| July | +1.1 % | 64 % |
| August | –0.2 % | 56 % |
| September | –0.7 % | 45 % |
| October | +0.5 % | 60 % |
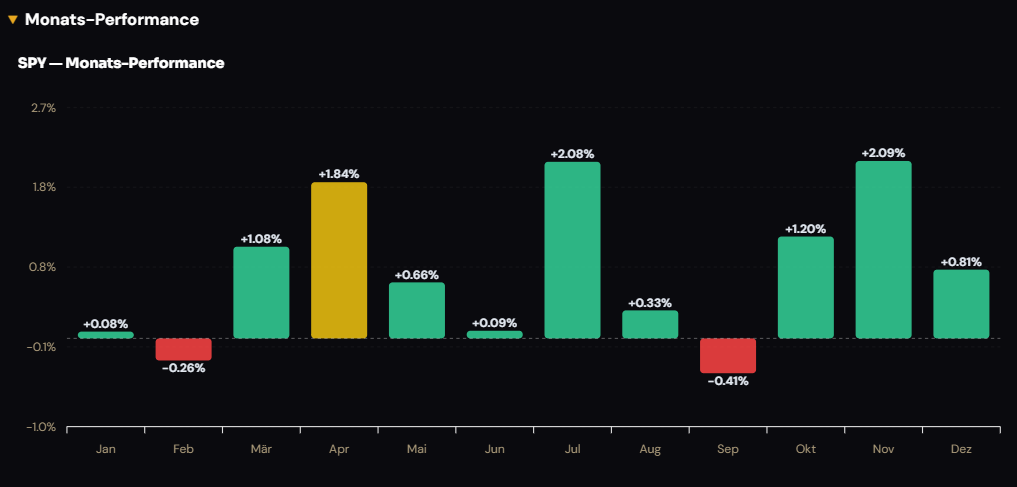
September is the statistically worst month of the year — the only month with a win rate below 50 % (45 %) and an average return of –0.7 %. May itself is not the real problem. Investors who strictly trade "Sell in May" are not actually avoiding May; they are avoiding June through September.
What Does This Mean for 2026?
2026 is a midterm year in the US presidential cycle, and midterm years have historically produced the deepest drawdowns of all four cycle years. This means: the already weak summer could turn out even weaker in 2026 than the historical average.
The combined expectation for May–October 2026:
- Sell-in-May baseline: avg. +1.4 % at a 62 % win rate
- Midterm adjustment: on average –4 PP relative to the cycle mean
- 2026 expectation: weaker performance than usual, higher volatility, greater drawdown risk
This is not a forecast — it is the historical expectation based on 33 midterm years since 1898.
How to Use the Effect Yourself
There are three pragmatic approaches:
- Strict: Reduce equity exposure on 1 May, rebuild on 1 November. Simple, but too rigid — misses many good summer months.
- Tactical: Rotate into defensive sectors in summer (Healthcare, Consumer Staples, Utilities) instead of exiting entirely. Reduces drawdown risk without leaving the market.
- Halloween Strategy with Filter: Avoid only the statistically weakest months within the six summer months (June–September). May and October are on average positive.
We have implemented the effect for 22 different strategies on the Plain Vanilla page with backtests and significance tests — you can review every variant with real data there.
Conclusion: Still Alive — but with Caveats
"Sell in May" is not dead. The effect remains statistically highly significant 130 years after its discovery and has become stronger rather than weaker in recent decades. What has changed: the rigid May/November rule is not optimal. Investors who avoid June–September while keeping May and October have historically performed better than strict Sell-in-May traders.
For 2026 as a midterm year, there is an additional consideration: risk management in summer is more important than usual. The dashboard at seasonalpha.ai/dashboard?t=^GSPC shows you at any time where we currently stand in the cycle.
---
FAQ
Does "Sell in May" still work in 2026?
Yes — the statistical effect is intact. The spread between the Best Six Months (November–April) and Worst Six Months (May–October) in the S&P 500 has been +3.8 percentage points over the last 130 years and has actually widened in recent decades. However, the effect is a probability, not a certainty: in roughly 38 % of years, summer still outperforms winter.
Which month is actually the worst for stocks?
September, not May. September is the only month of the year with a win rate below 50 % (45 %) and an average return of –0.7 %. May itself averages +0.2 %. If you want to avoid only the single worst month, September is the clear target.
How does the Halloween Strategy differ from "Sell in May"?
Both are based on the same seasonal anomaly: winter months outperform summer months. "Sell in May" exits on 1 May and re-enters on 1 November. The Halloween Strategy (also called Best Six Months Strategy) uses the same window but sometimes applies additional filters — for example, a MACD signal to avoid entering in November when the trend is still bearish.
Is the effect stronger or weaker in a midterm year?
Historically weaker. In midterm years (2022, 2018, 2014 ...) the summer drawdown is on average deeper than in other years of the presidential cycle. The combination of Sell-in-May weakness and midterm-year uncertainty has historically been the most challenging six months for long-only equity strategies.
Can I implement this strategy with ETFs?
Yes. The simplest version: hold SPY or a global equity ETF from November through April; switch to a money market ETF or short-duration bond ETF (e.g. SHV, BIL) from May through October. Transaction costs and taxes must be factored in. A tactical variant rotates into defensive sector ETFs (XLV, XLP, XLU) instead of exiting equities entirely.
---